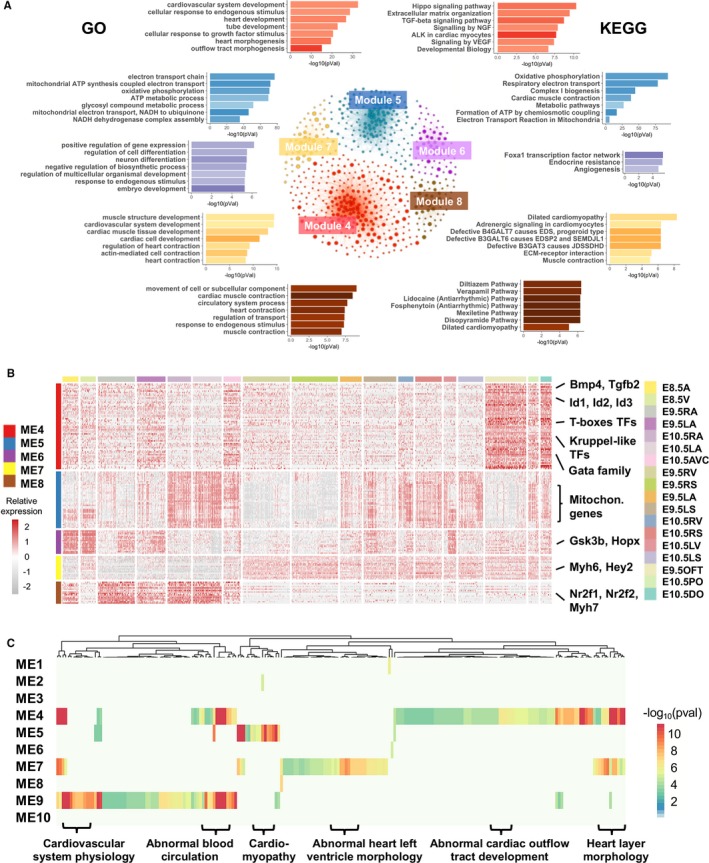
Figure 4.

Enrichment analysis of genes in selected modules. A, The top 7 representative enriched Gene Ontology (GO) terms and Kyoto Encyclopedia of Genes and Genomes (KEGG) pathways in the 5 selected modules. The networks in the middle illustrate the co‐expression networks of genes in these modules, with the nodes representing genes and node sizes proportion to the numbers of co‐expressed genes. Functional terms and pathways for individual modules are depicted by matching colors. B, Expression patterns of hub genes in 5 selected modules. C, Enriched phenotype‐ and disease‐associated gene sets in the modules. The gene sets (columns) associated with heart phenotypes and diseases were enriched in the gene modules. The colors in the heat‐map show statistical significance of enrichments, and some representative gene sets are labeled at the bottom. ALK indicates Anaplastic lymphoma kinase; EDS, Ehlers‐Danlos syndrome; EDSP, Ehlers‐Danlos syndrome progeroid; JDSSDHD, joint dislocations, short stature, craniofacial dysmorphism, and congenital heart defects; SEMDJL, Spondyloepimetaphyseal dysplasia with joint laxity; NGF, nerve growth factor.
