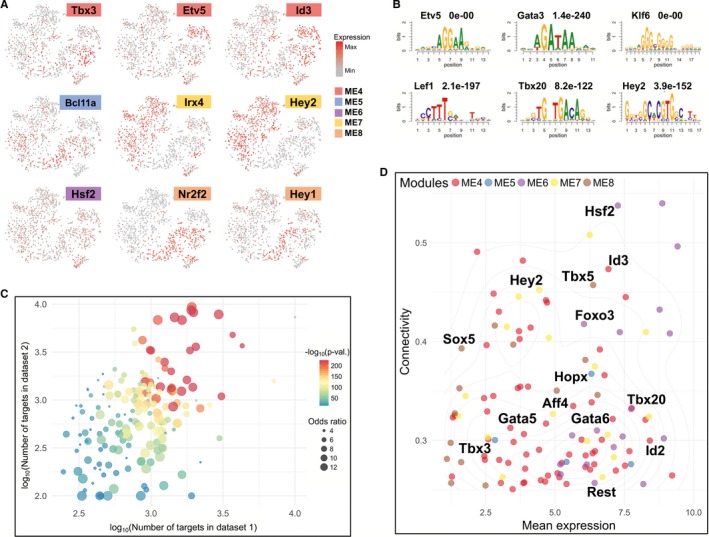
Figure 5.

Spatiotemporally expressed TFs and their potential targeted genes. A, Expression patterns of 9 representative TFs (transcription factors) in the selected modules. B, The enriched motifs in the predicted targets of the representative TFs, with TF names and q‐values at the top. C, Preservation of TF‐targets. Bubbles in the plot represent different TFs, with colors for the significance of preservation and sizes for odds ratios of target overlap. D, Mean expression and eigengene‐based connectivity of the candidate TF drivers (n=123). In plot, x‐axis represents the correlations between TFs’ expression profiles and their corresponding module eigengenes, while y‐axis represents the average expression values for TFs. TFs indicates transcription factors.
