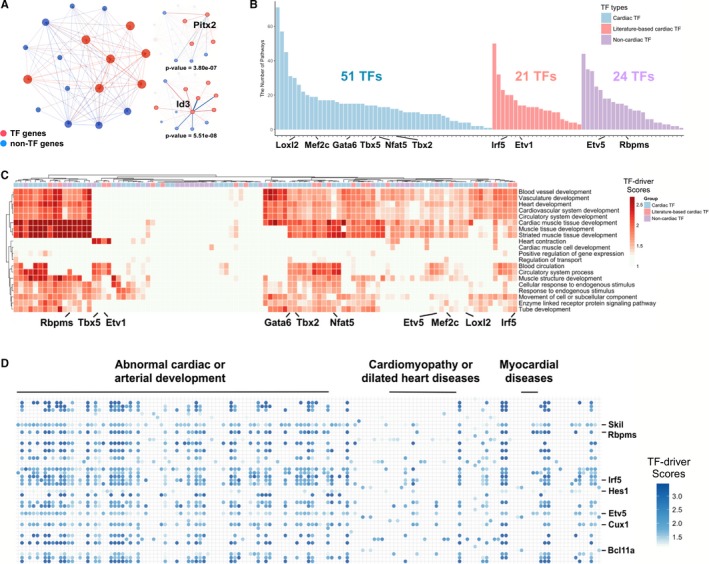
Figure 6.

Function and phenotype analysis of cardiac and noncardiac TF targets. A, A network showing genes in the transforming growth factor β signaling. In left panel, 17 genes of module 4 were in this pathway, with overrepresentation P=1.91e‐09. Node and edge connections in right panel represent adjacencies between a TF and its targets, 12 genes targeted by Id3 and 7 genes for Pitx2. B, The number of enriched pathways (y‐axis) under the regulations of cardiac, literature‐based cardiac, and noncardiac TFs. C, Predicted regulations of cardiac, literature‐based cardiac, and noncardiac TFs in 20 representative heart terms enriched in the selected weighted gene co‐expression network analysis modules. The colors in the heat‐map show the TF‐driver scores in functional terms, representing the regulatory effects of individual TFs on the terms. D, Predicted functional roles of literature‐based cardiac and noncardiac TFs in different heart phenotype‐ or disease‐associated gene sets, with the colors for TF‐driver scores. TF indicates transcription factor.
