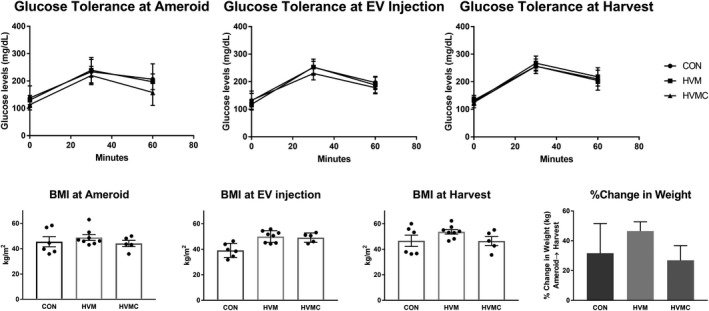
Figure 1.

Glucose tolerance test and body mass index (BMI) values. There was no significant difference in glucose tolerance between any of the groups at any of the time points. The 30‐ and 60‐minute values at all time points in all groups reflect impaired glucose tolerance consistent with metabolic syndrome. The BMI levels were consistently higher in the high‐fat diet with myocardial extracellular vesicle (EV) injection group (HVM) when compared with the control group at all time points; however, there was no significant difference in percentage change of weight gain between the groups. Data were analyzed using Student t test. CON indicates control group (high‐fat diet with vehicle injection); HVMC, HVM and calpain inhibition group. *P<0.05 was considered significant.
