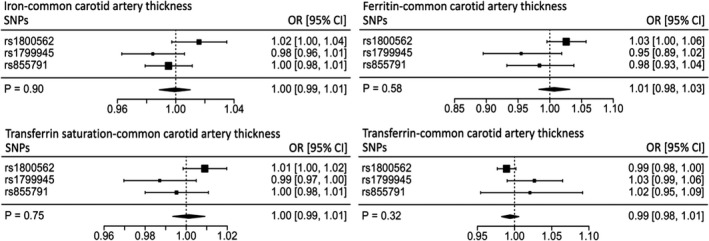
Figure 3.

Individual SNP and pooled MR estimates for the effect of iron status on carotid intima‐media thickness. Results for each biomarker are represented in a different forest plot. Each square represents an individual SNP MR estimate, with size proportional to the precision of the estimate, and horizontal lines representing 95% CIs. The diamonds underneath represent the pooled MR estimate, with corresponding widths representing 95% CIs. MR indicates Mendelian randomization; OR, odds ratio; SNP, single‐nucleotide polymorphism.
