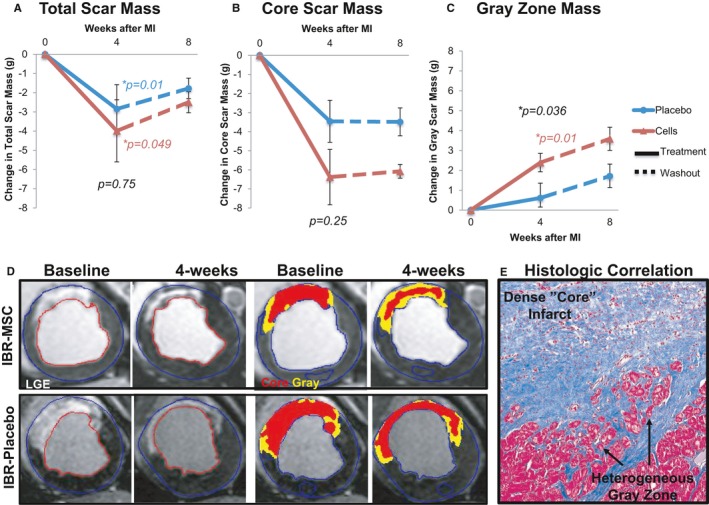
Figure 7.

Change in infarct mass. Total infarct mass assessed by late gadolinium‐enhanced (LGE) MRI significantly decreased in both the implantable bioreactor mesenchymal stem cell (IBR‐MSC) and IBR‐Placebo groups over the 4 weeks following implantation (A). Over the same period, dense “core” zone mass decreased significantly in both groups, although the magnitude was greater in the IBR‐MSC than in the IBR‐Placebo group (−6.38 g vs −3.46 g) (B). This decrease in core mass was accompanied by a significant increase in the heterogeneous peri‐infarct “gray” zone in the IBR‐MSC but not in the IBR‐Placebo animals (C). During the 4‐week “washout” phase following IBR removal (dashed lines), there were no significant differences in scar size change between the groups. Colored P values indicate significant differences for paired analyses where present. Black P values show results of unpaired analyses at 4 weeks; there were no significant differences between the groups from weeks 4 to 8 (P values not shown). Representative images of LGE extent at baseline and 4 weeks along with quantification of core (red) and peri‐infarct gray zone (yellow) masses are shown (D). Masson's trichrome stain of the infarct border zone corresponding to the MRI gray zone revealed heterogeneous tissue containing viable myocytes intermixed with scar tissue (E).
