Figure 1.

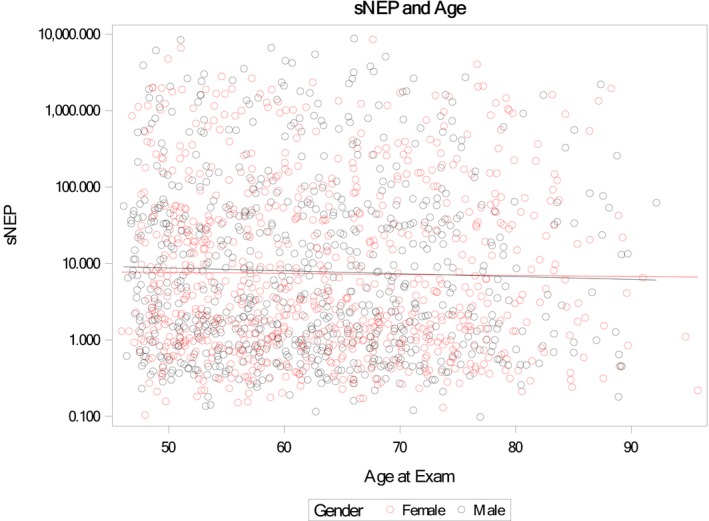
Scatter plot of age (x‐axis) vs soluble neprilysin (sNEP; y‐axis log scale) by sex. The Spearman correlation coefficients between age and neprilysin were −0.04 overall, −0.04 for male participants, and −0.03 for female participants.

Scatter plot of age (x‐axis) vs soluble neprilysin (sNEP; y‐axis log scale) by sex. The Spearman correlation coefficients between age and neprilysin were −0.04 overall, −0.04 for male participants, and −0.03 for female participants.