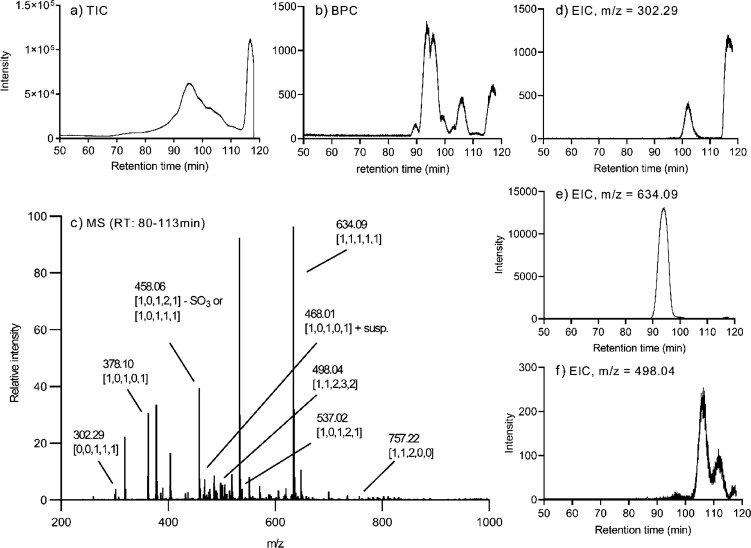
Figure 1.
Representative extracted MS spectrum and chromatograms for chondroitinase ABC-digested CS extracted from salmon muscle and connective tissues. (a) TIC, (b) BPC, and (c) extracted MS spectrum from SEC-LC/MS analysis. (c) Various peaks analyzed are labeled with m/z values and description of composition using the nomenclature described previously.30 EICs of relatively abundant CS oligosaccharides are illustrated in (d) dp1 [0,0,1,1,1], (e) dp3 [1,1,1,1,1], and (f) dp4 [1,1,2,3,2].

