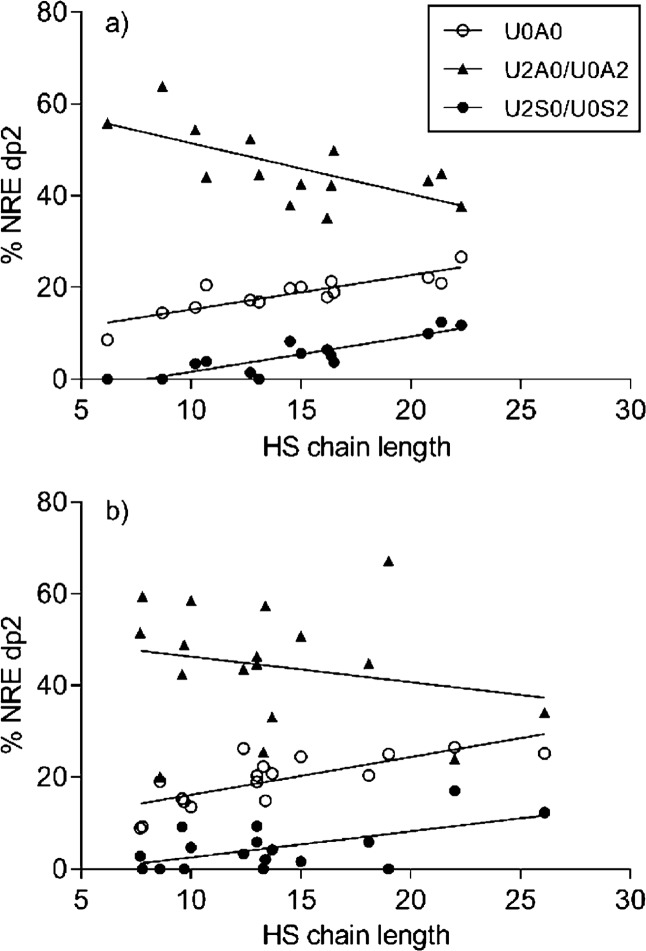
Figure 6.
Distribution of HS disaccharides at the NRE compared to chain length for (a) intact and (b) gaping samples. Linear regression values for (a) intact tissue were as follows: U0A0, R2 = 0.73, p < 0.0001; U2A0/U0A2, R2 = 0.44, p = 0.0094; U2S0/U0S2, R2 = 0.77, p < 0.0001. Linear regression values for (b) gaping tissue were as follows: U0A0, R2 = 0.56, p < 0.0005; U2A0/U0A2, R2 = 0.05, p = 0.4103; U2S0/U0S2, R2 = 0.35, p < 0.0128.

