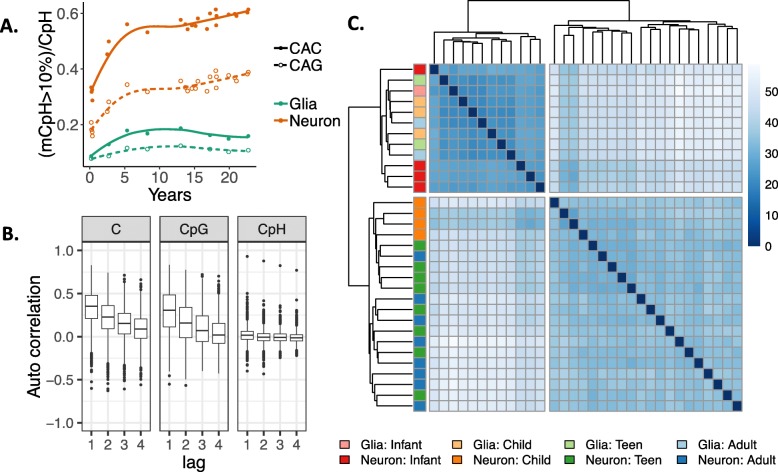
Fig. 2.
CpH methylation patterns across brain development. a The proportion of CAC and CAG sites that are greater than 10% methylated in neurons and non-neurons (glia) across brain development. The y-axis reflects the number of > 10% methylated CAC or CAG sites divided by the number of CAH sites in that trinucleotide context. b Autocorrelation levels for different cytosine contexts in neurons. Autocorrelation levels were similar for mCpG and all cytosines, with uncorrelated levels in the CpH context. c Euclidean distances between samples based on mCpH within cdDMRs again cluster infant neurons (dark red) with glia of all ages (light colors) rather than with older neurons

