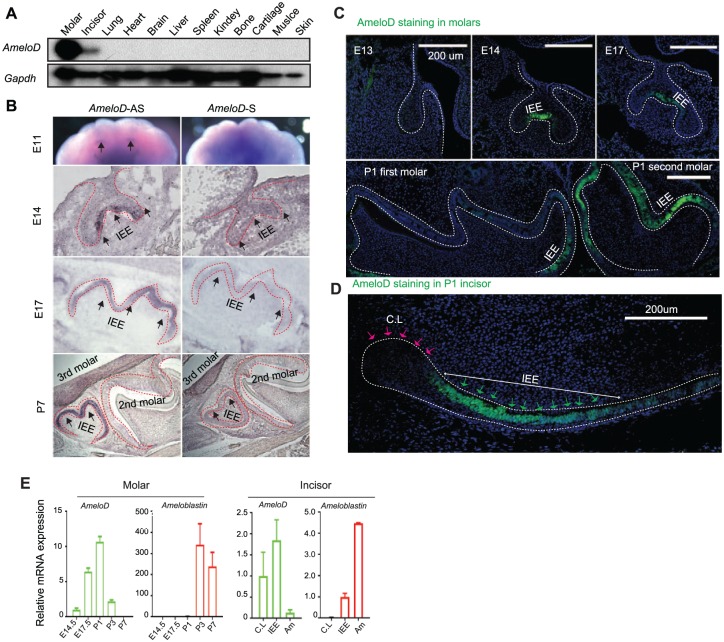
Figure 2.
Expression pattern of AmeloD. (A) Northern blot analysis of AmeloD expression in different tissues from the postnatal day 1 (P1) mouse, and the results show that AmeloD is uniquely expressed in the mouse molars and incisors. (B) In situ hybridization of AmeloD expression in the embryonic day 11 (E11) maxilla and E14, E17, and P7 mouse molars (secondary and third molars). AS, anti-sense probe; S, sense probe. The arrow indicates the expression of AmeloD transcript. (C) Immunofluorescence staining of AmeloD expression with AmeloD antibody (green) in E13.5, E14.5, E17.5, and P1 molar sections (first and second molars). (D) Immunofluorescence staining of AmeloD with anti-AmeloD antibody (green) in the sagittal section of the P1 mouse incisor. The red arrows indicate the cervical loop (CL) region of mouse incisor, and the green arrows indicate IEE cells. Scale bar: 200 µm. (E) Quantitative polymerase chain reaction gene expression analysis of AmeloD and ameloblastin expression during mouse molar and incisor development. Values are presented as mean ± SD (n = 3). IEE, inner enamel epithelium. Am, ameloblast.

