Figure 3.
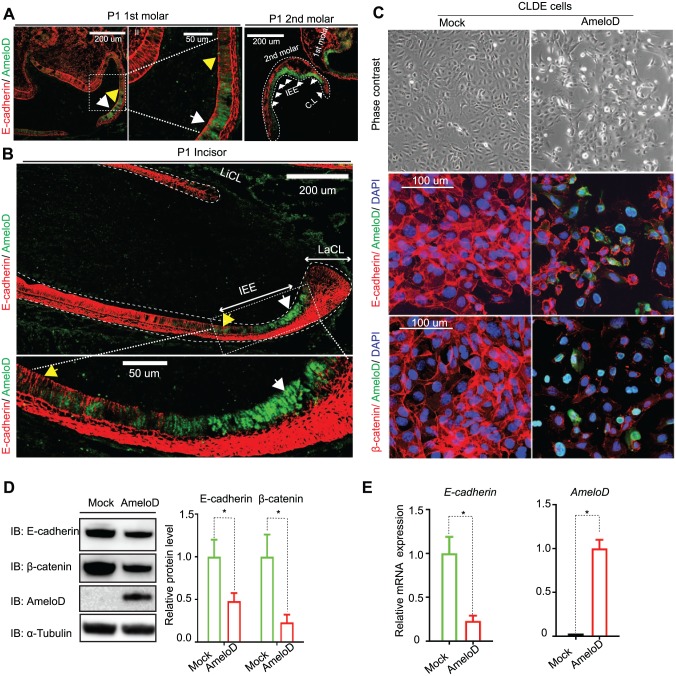
AmeloD inhibits E-cadherin expression in progenitor ameloblasts. Immunofluorescence staining of AmeloD (green) and E-cadherin (red) in postnatal day 1 (P1) mouse (A) molars and (B) incisors. The white arrows indicate cells that have a high level of AmeloD expression (green color) and a low level of E-cadherin expression (red color), and the yellow arrows indicate cells that have a low level of AmeloD expression and a high level of E-cadherin expression. (C) Overexpression of AmeloD in CLDE cells suppressed E-cadherin expression. Phase contrast images showed that AmeloD overexpression resulted in morphologic changes in CLDE cells (top panel); immunofluorescence staining of AmeloD (green) with E-cadherin (red) or AmeloD (green) with beta-catenin (red) showed that overexpression of AmeloD in CLDE cells resulted in E-cadherin and beta-catenin degradation. (D) CLDE cells were transfected by control and AmeloD constructs, with Western blot analysis of E-cadherin and beta-catenin protein levels in CLDE cells after 72 h of transfection. Quantitative analysis was done by Image J. (E) Quantitative polymerase chain reaction gene expression analysis of E-cadherin and AmeloD expression in CLDE cells 72 h after transfection of control and AmeloD constructs. Data are shown as mean ± SD (n = 3). Statistical significance is shown by a t test. *P < 0.05.

