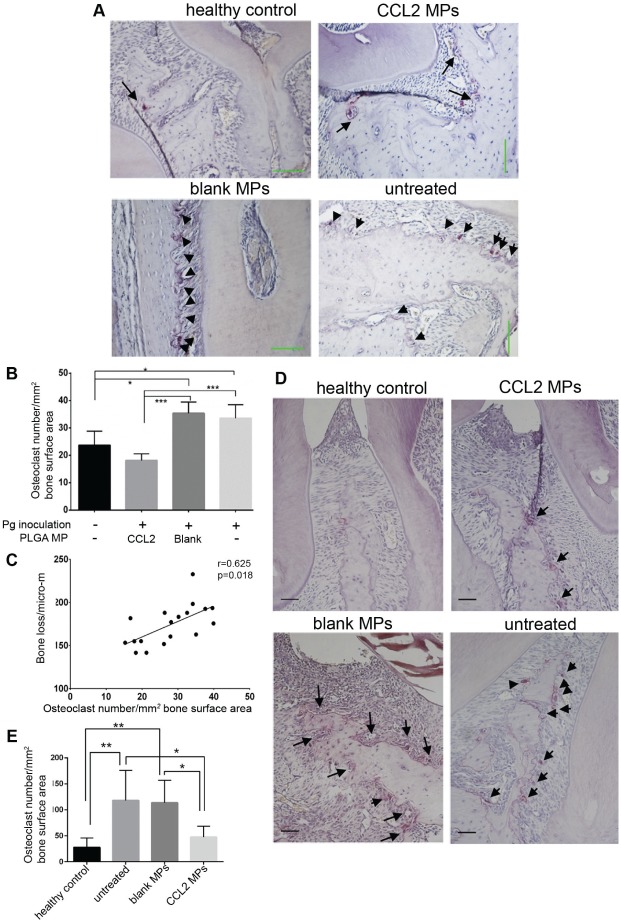
Figure 4.
The sustained CCL2 release formulation significantly downregulates osteoclast numbers in mouse periodontitis models. (a) Representative TRAP staining images from Pg mice model for osteoclasts. Row 1, left to right: healthy control, CCL2 MPs; row 2, left to right: blank, untreated. Each arrow or arrowhead indicates an osteoclast; final magnification, 200×. Scale bar = 100 um. (b) Comparison of osteoclasts number/mm2 of bone surface area among treatment groups; the healthy and CCL2 formulation–treated groups had statistically fewer osteoclasts than the untreated and blank groups. (c) Osteoclast numbers were significantly correlated with the severity of alveolar bone loss, measured as numbers of osteoclasts/mm2 of alveolar bone surface area to bone loss (the CEJ-ABC distance of the interdental planes), with a Pearson’s correlation coefficient of r = 0.623. n = 4 or 5/group. *P < 0.05, ***P < 0.001 by 1-way ANOVA, post hoc Tukey HSD test. (d) Representative TRAP staining pictures from ligature mice model. Row 1, left to right: healthy control, CCL2 MPs; row 2, left to right: blank MPs, untreated. Each arrow or arrowhead indicates an osteoclast; final magnification, 200×. All scale bars: 50 μm. (e) Comparison of osteoclasts numbers/mm2 of bone surface area among treatment groups; healthy and CCL2 formulation–treated groups had statistically fewer osteoclasts than either the untreated group or the blank PLGA MP group. n = 6/group. **P < 0.005 by 1-way ANOVA, post hoc Tukey HSD test. Error bars indicate SD. ANOVA, analysis of variance; CEJ-ABC, cementoenamel junction–alveolar bone crest; CCL2, C-C motif chemokine ligand 2; HSD, honestly significant difference; MP, microparticle; Pg, Porphyromonas gingivalis; TRAP, tartrate-resistant acidic phosphatase.

