FIGURE 1:

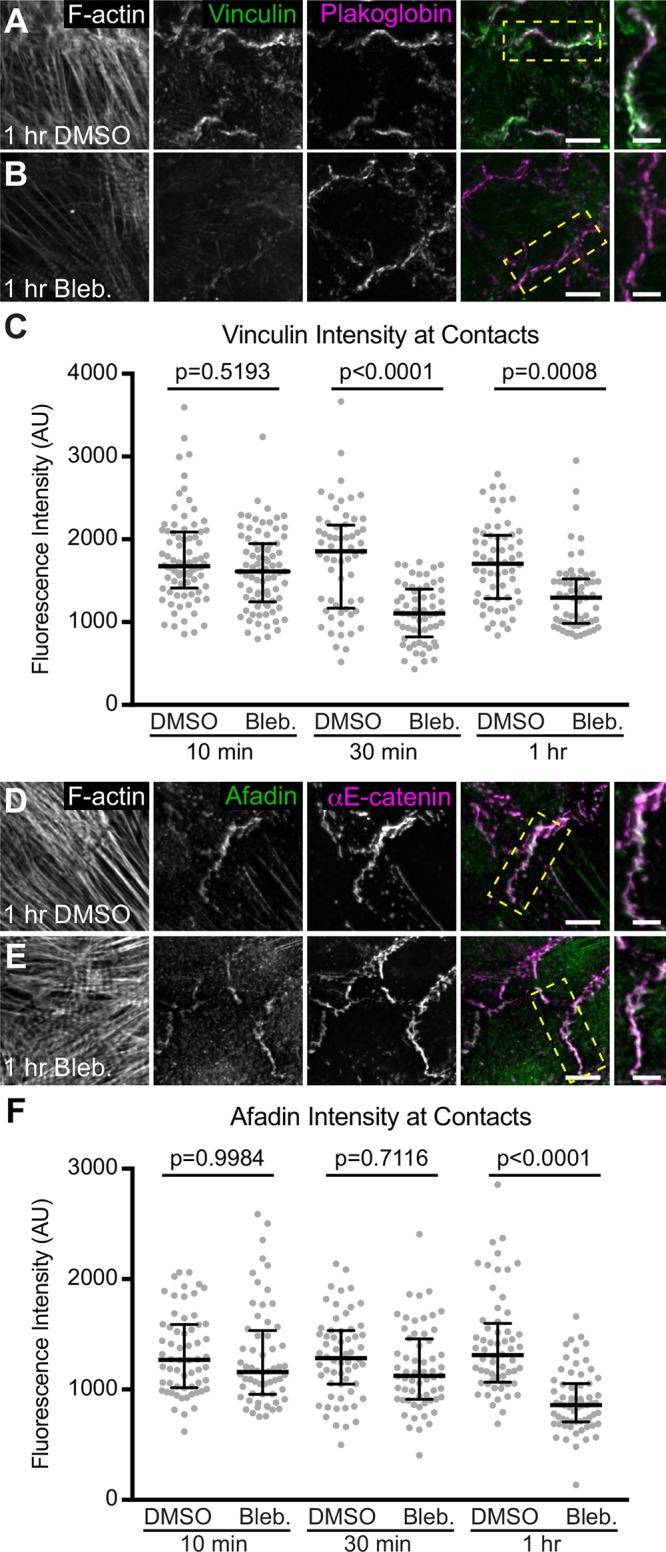
Vinculin and afadin recruitment to cardiomyocyte AJs is tension dependent. (A–E) Mouse neonatal cardiomyocytes were treated for 1 h with DMSO (A, D) or 100 μM blebbistatin (B, E) before fixation. Cells were stained for F-actin (A, B, D, and E), vinculin, and plakoglobin (A, B), or afadin and αE-catenin (D, E). Individual and merged vinculin (green) and plakoglobin (magenta) channels shown in A and B. Individual and merged afadin (green) and αE-catenin (magenta) channels shown in D and E. Far right column is a higher magnification of the boxed contact in merge. (C, F) Quantification of vinculin (C) or afadin (F) intensity at cell–cell contacts. Vinculin or afadin signal intensity was measured in cells treated with DMSO or blebbistatin for 10, 30, and 60 min before fixation. All data points are plotted. Middle horizontal bar is the median and error bars represent the quartile range. One-way ANOVA, n ≥ 60 images from at least three independent experiments. Images are maximum projections of 5 µm stacks. Scale bar is 10 μm in lower-magnification images, 5 μm in higher-magnification images.
