FIGURE 4:
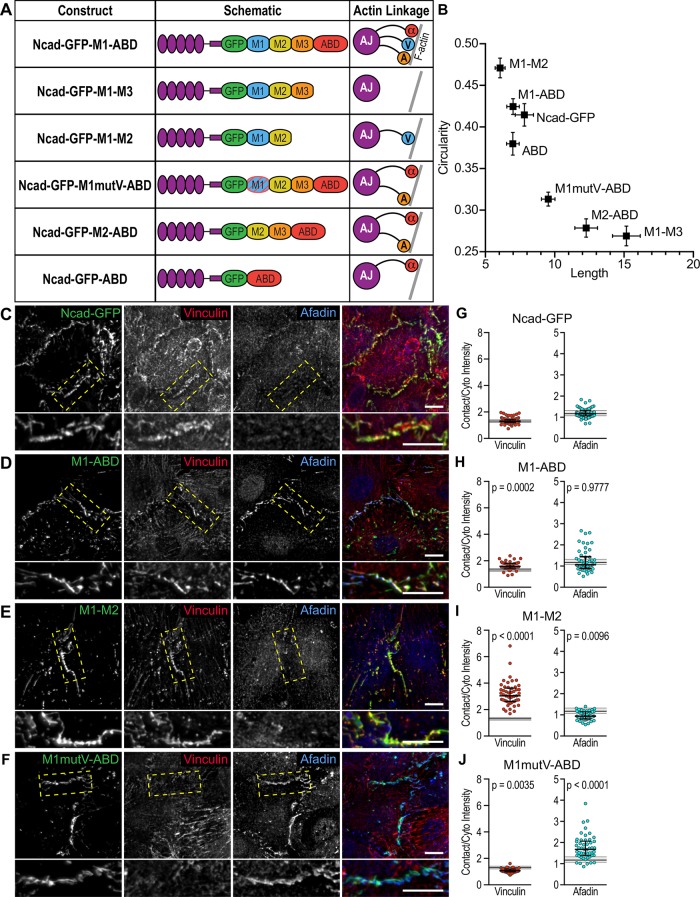
N-cadherin-GFP-αE-catenin fusions selectively recruit ligands to cardiomyocyte cell–cell contacts. (A) Table of N-cadherin-GFP-αE-catenin fusion constructs used in this study. Nomenclature, domain schematic, and actin linkage cartoon are shown. (B) Quantification of N-cadherin-GFP-αE-catenin fusion cell–cell contact morphology. Mean contact length plotted against mean contact circularity. Error bars represent SEM. Data are from at least 180 individual cell–cell contacts from two independent infections with each fusion construct. (C–F) Cardiomyocytes infected with Cre and N-cadherin-GFP (C) or Cre and fusion adenoviruses (D–F), fixed, and stained for vinculin and afadin. Individual and merged GFP (green), vinculin (red), and afadin (blue) channels are shown. Images are a maximum projection of 2–3 μm deconvolved stacks. Bottom image is a higher magnification of boxed contact. (G–J) Quantification of vinculin and afadin intensities at cell–cell contacts. Signal intensity at contacts was divided by the average cytoplasmic intensity and a scatter plot of all data points is shown. The black horizontal line is the median and the error bars define the interquartile range. The shaded gray region in each plot defines the median (thick gray line) and interquartile range (thin gray lines) of vinculin or afadin recruitment observed with full-length N-cadherin-GFP (G) for comparison. One-way ANOVA, significance compared with recruitment with N-cadherin-GFP; n ≥ 50 images from at least two independent experiments. Scale bar is 10 μm in all images.

