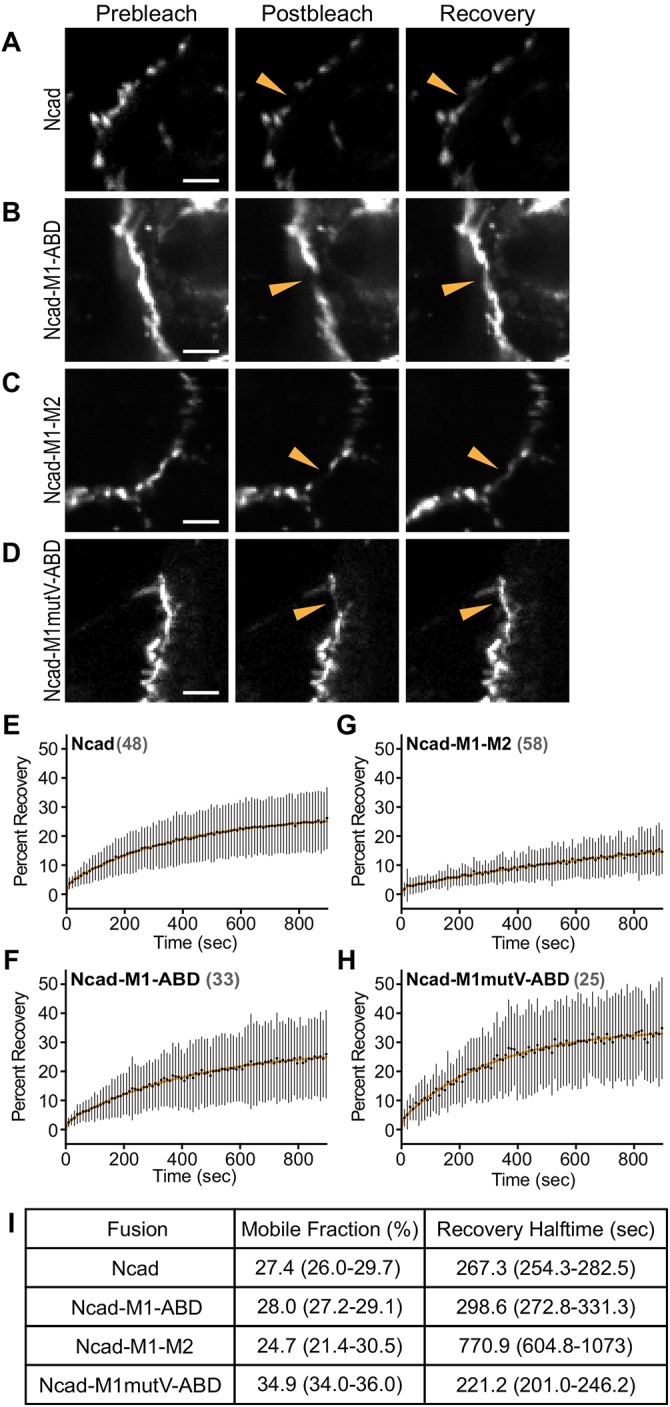
FIGURE 5:

N-cadherin-GFP-αE-catenin fusion dynamics at cardiomyocyte cell–cell contacts. (A–D) Representative prebleach, postbleach, and recovery images from FRAP studies of Ncadfx/fx cardiomyocytes infected with Cre and N-cadherin-GFP (A) or Cre and N-cadherin-GFP-αE-catenin fusion adenoviruses (B–D). Orange arrowhead marks the FRAP region at a cell–cell contact. (E–H) Plots of mean ± SD FRAP recovery fraction over 15 min. The mean is represented by a black circle, and the SD is shown as a black line. The data were fitted to a double-exponential curve (orange line). The numbers of FRAP regions measured for each fusion construct are listed in gray. FRAP data were collected from at least two independent infections for each fusion. (I) Summary of the mobile fraction (percentage) and recovery halftime (seconds). Scale bar is 5 μm in A–D.
