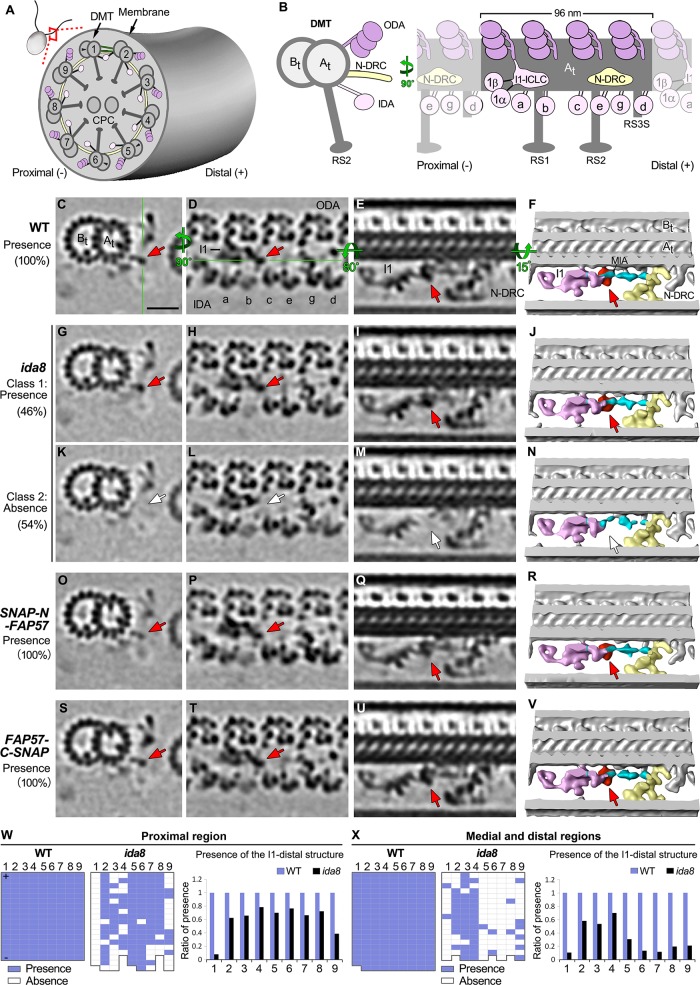
FIGURE 6:
Cryo-ET and class averaging of ida8 reveal defects in a density located between I1 dynein and the MIA complex. (A) Diagram of a Chlamydomonas cell and one of its two flagella shown in cross-section with nine outer DMT1–9 surrounding the CPC. (B) Diagram of a single DMT shown in cross-section view (left) and longitudinal view from the perspective of the neighboring DMT (right), with the A- and B-tubules (At and Bt). The DMT is built up by a series of 96 nm axonemal repeats, each of which contains four three-headed ODAs (dark pink) on top, three RSs (RS1, RS2, and the shorter RS3S) at the bottom, and seven distinct IDAs (light pink) and the N-DRC (yellow) in the middle region. The two-headed I1 dynein is located at the proximal end, with its 1α and 1β dynein heads connected to the I1 IC/LC domain. The six single-headed IDAs (a, b, c, e, g, d) are attached to specific sites along the repeat. (C–E) Tomographic slices of the class average of the 96 nm repeat of WT axonemes showing the I1-distal structure in three different views: a cross-section of 96 nm repeat through the I1-distal structure (C), a longitudinal section of the 96 nm repeat through the dyneins (D), and another longitudinal section that rotates 80 degrees (E). The green lines indicate the locations of the slices shown in next panel. Classification analysis showed that all WT repeats have the I1-distal structure. (F) Iso-surface renderings corresponding to image in E, but with a small rotation for a better 3D view of the I1-distal structure (red) and its neighboring complexes: I1 dynein complex (pink), N-DRC (yellow), MIA complex (cyan). (G–N) Images of the two class averages of the 96 nm repeats in ida8. In Class 1 repeats (∼46%), the I1-distal structure was present (G–J, red arrows); in Class 2 repeats (∼54%), the I1-distal structure was missing (white arrows), and the MIA complex (cyan) appeared slightly shifted in N. (O–V) Images of SNAP-N-FAP57 (O–R) and FAP57-C-SNAP (S–V) rescued axonemes, showing reassembly of the I1-distal structure (red arrows). (W, X) The presence (blue grids) or absence (white grids) of the I1-distal structure in each 96 nm repeat was scored for individual DMTs in the tomograms taken from the proximal (W) or medial/distal regions (X) of the axoneme. Flagellar polarity is indicated by "+" and "–" ends. The WT data set contained five proximal and 20 medial/distal tomograms, whereas the ida8 data set contained 16 proximal and 17 medial/distal tomograms. The averaged histograms on the right depict the ratio of repeats with the I1-distal structure relative to all repeats on the individual DMTs. Scale bar in C is 20 nm.

