FIGURE 7:
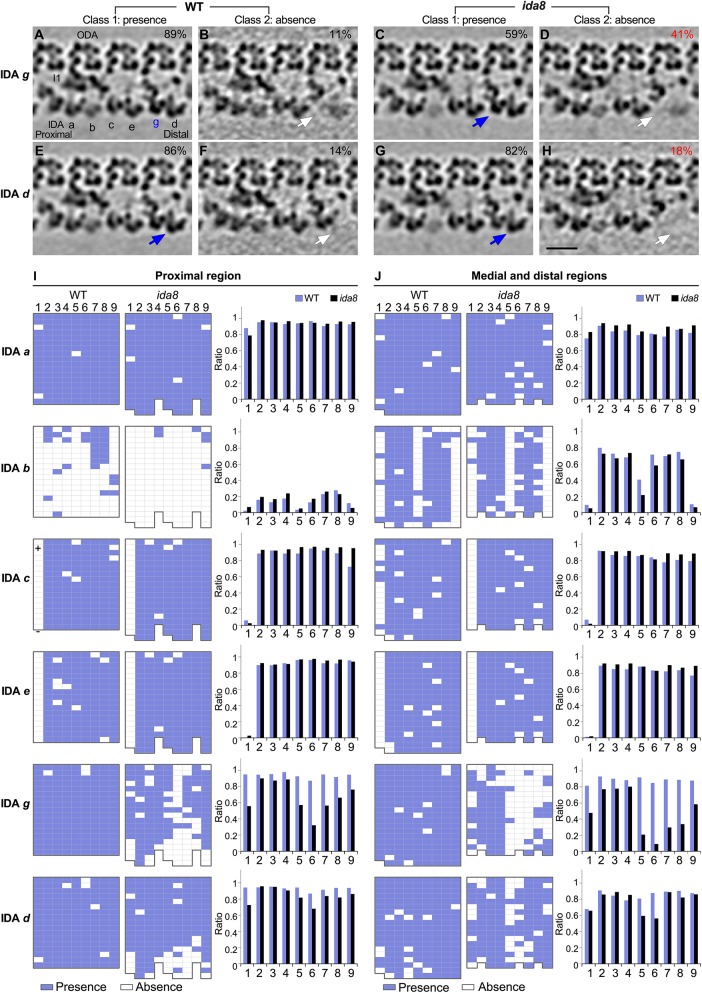
Cryo-ET and class averaging reveal defects in the assembly of IDAs d and g on specific DMTs in ida8. The WT and ida8 repeats were analyzed for the presence (Class 1) or absence (Class 2) of each single-headed IDA (a, b, c, e, g, d). (A–H) Tomographic slices of the class averages of the 96 nm repeat, with four ODAs on top and the single-headed IDAs at the bottom, showing the presence (Class 1, blue arrows) or absence (Class 2, white arrows) of the IDAs g and d, which are reduced in many ida8 repeats. The percentage of subtomograms included in each class average is indicated. (See Supplemental Figure S7 for the class averages of all the single-headed IDAs.) (I, J) The presence (blue grids) or absence (white grids) of the indicated IDA in a 96 nm repeat was scored for each DMT (1–9) in tomograms taken from the proximal (I) or medial and distal (J) regions of the axoneme. The WT data set contained five proximal and 20 medial/distal tomograms, whereas the ida8 data set contained 16 proximal and 17 medial/distal tomograms. The averaged histograms on the right depict the ratio of repeats with the indicated IDA relative to all of the repeats for each DMT (1–9). Classification analysis showed that the assembly of dyneins a, b, c, and e in ida8 was not significantly different from WT. However, more ida8 repeats lacked IDAs g and d than WT (D, H), and the defect in assembly was biased toward DMTs 1 and 5–9. Scale bar in H is 20 nm.

