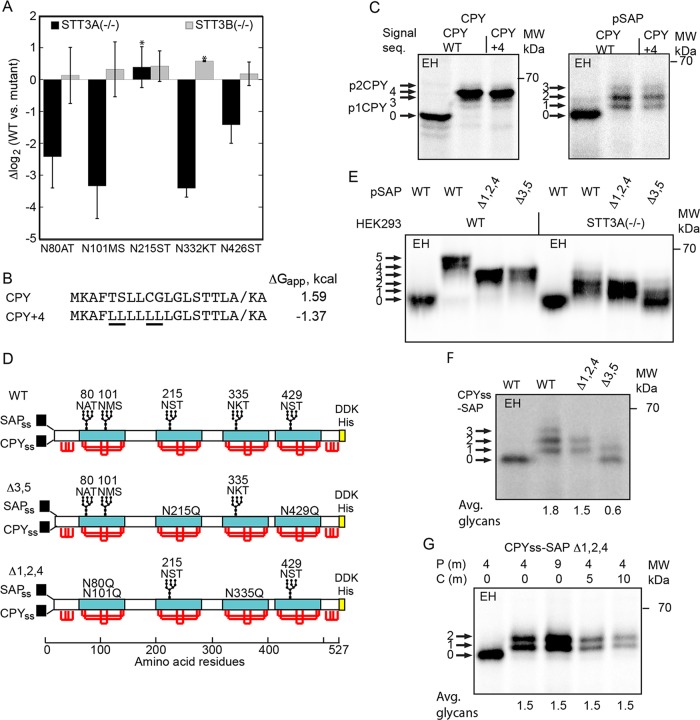
FIGURE 3:
Glycosylation of human prosaposin in yeast and human cells. (A) SILAC-based glycoproteomic analysis of prosaposin glycosylation in HEK293-derived cells that lack either the STT3A or STT3B complex. Site occupancy is expressed as Δlog2, where a negative value indicates reduced glycosylation in the mutant cells relative to the wild-type cells. Error bars designate standard deviations (n = 3–7) or individual data points (*, n = 2). (B) Signal sequences for wild-type CPY and a more hydrophobic derivative (CPY+4). The underlined leucine residues in CPY+4 replace marginally hydrophobic amino acids. The diagonal line designates the signal sequence cleavage site. (C) CPY and pSAP constructs that have the CPY signal sequence or the CPY+4 signal sequence were pulse-labeled for 7 min with Tran-35S label in wild-type yeast cells. (D) Diagrams of the SAP, SAPΔ3,5, and SAPΔ1,2,4 constructs for expression of prosaposin derivatives in yeast and human cells. The signal sequences for human prosaposin (SAPss) and yeast CPY (CPYss) are for expression in HEK293 cells and yeast, respectively. Saposin domains are designated by cyan rectangles. Red lines designate disulfides. The disulfide bonding pattern of the N-terminal and C-terminal flanking domains is not known. A C-terminal DDK-His tag was appended for immunoprecipitation with anti-DDK sera. (E) Pulse labeling (10 min) of pSAP, pSAPΔ1,2,4, and pSAPΔ3,5 in wild-type and STT3A-deficient HEK293 cells. (F) Pulse labeling (7 min) of SAP, SAPΔ3,5, and SAPΔ1,2,4 in yeast. (G) Pulse–chase labeling of CPYss-SAP (Δ1,2,4) in yeast using the indicated pulse (P) and chase (C) intervals. (F, G) Quantified values are of the experiment shown, which is representative of two or more replicates. In C and E–G, labeled arrows indicate the number of glycans. EH indicates digestion with endoglycosidase H.

