FIGURE 4:

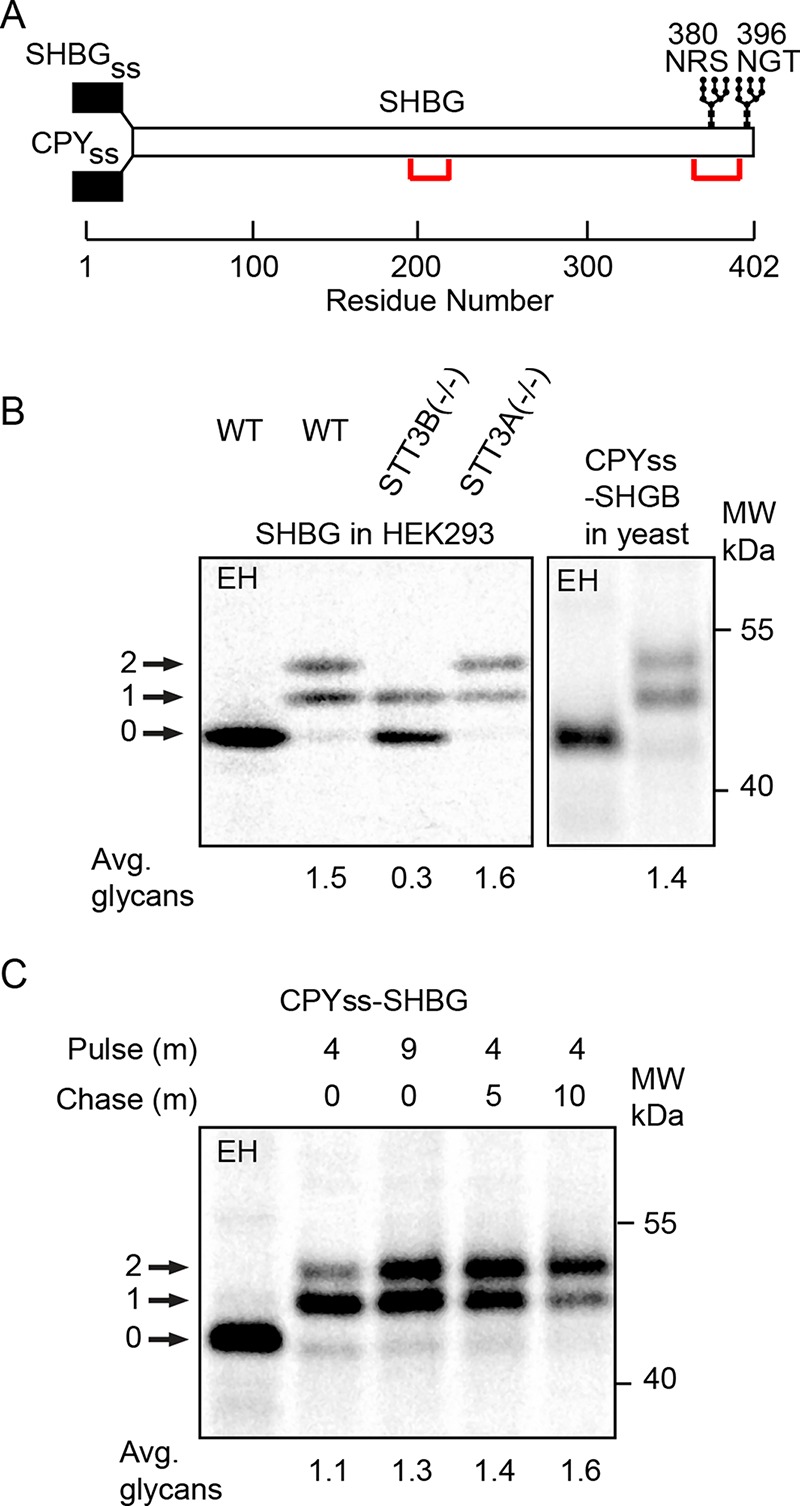
Pulse labeling of SHBG in human and yeast cells. (A) Diagram of SHBG showing signal sequences for expression of SHBG in human and yeast cells, the location of disulfide bonds, and the C-terminal glycosylation sites. (B) Pulse–chase labeling of SHBG in wild-type and mutant HEK293 cells (left panel, 5 min pulse, 20 min chase). Pulse labeling of CPYss-SHBG for 8 min in yeast cells (right panel). (C) Pulse–chase labeling of CPYss-SHBG in yeast using the indicated pulse (P) and chase (C) intervals. In B and C, quantified values are of the experiment shown, which is representative of two replicates. EH indicates digestion with endoglycosidase H.
