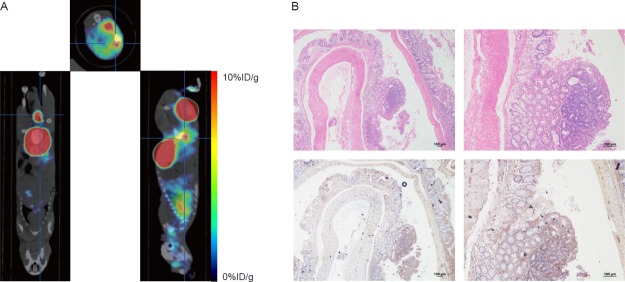
Figure 6.
PET/CT imaging with 18F-RWY in chemically induced CRC mice. (A) Representative PET/CT imaging with 18F-RWY in a chemically induced CRC mouse. (B) H&E and immunohistochemistry staining of tumor isolated from a chemically induced CRC mouse. Integrin α6 expression was analyzed using immunohistochemistry. Scale bar, 100 μm.

