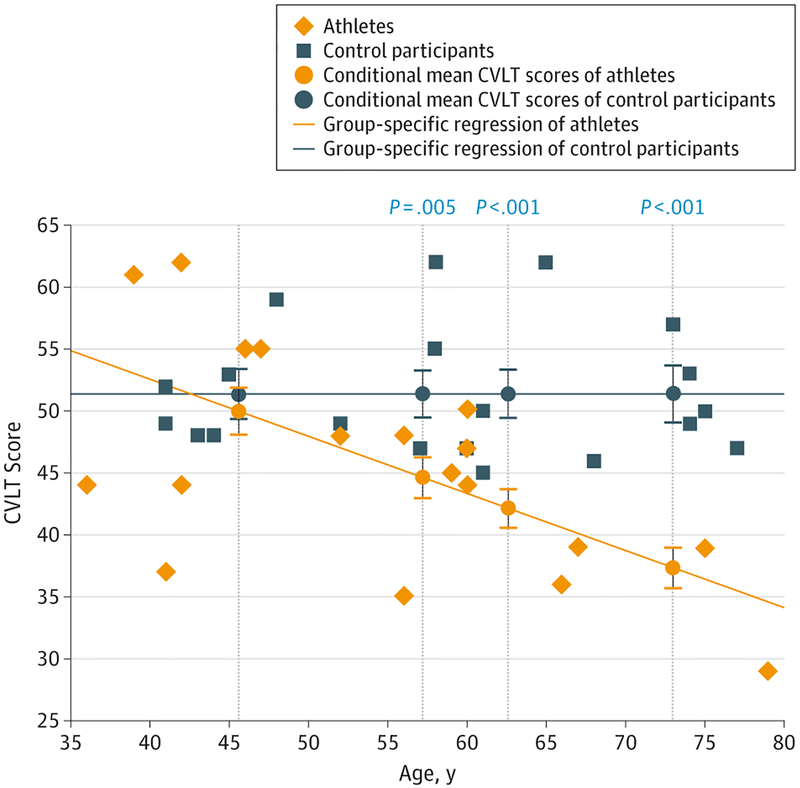
Figure 4. Scatterplot of Raw Total CVLT Scores as a Function of Age.
Average California Verbal Learning Test (CVLT) scores were compared between athletes and control participants at the 20th, 40th, 60th, and 80th age percentiles across the age spectrum. The mean scores at each age percentile were estimated by group-specific regressions. Error bars indicate standard error of the mea, and significant P values are displayed directly above each comparison between conditional means at the 40th, 60th, and 80th percentiles.

