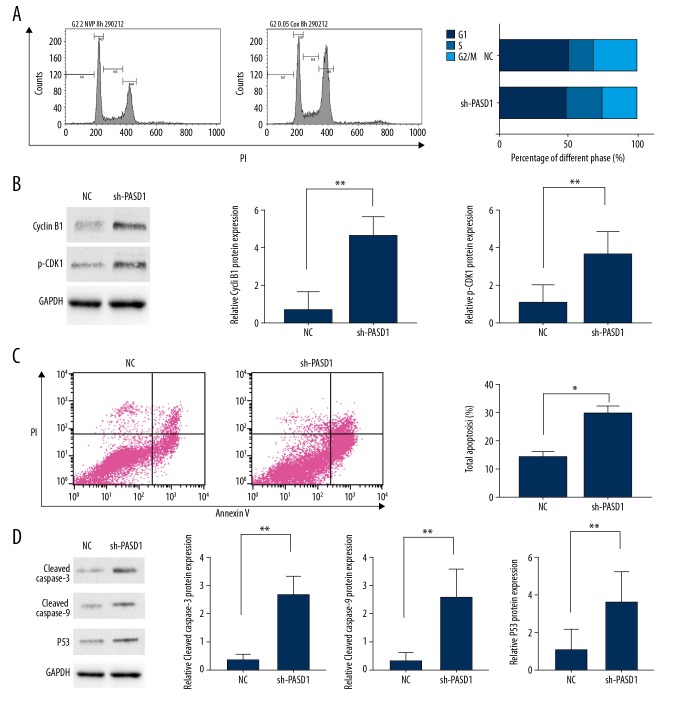
Figure 3.
Flow cytometric analysis of cell cycle and cell apoptosis. (A) Flow cytometry to detect cell cycle. Cell counts in different phases suggest that downregulation of PASD1 would result in cell arrest at G2/M phase. (B) Results of western blot assay on cyclin B1 as well as CDK1 expression. (C) Flow cytometric analysis of cell apoptosis and the percentage of total apoptosis cells showed that downregulation of PASD1 accelerated apoptosis. (D) Western blot analysis of cleaved caspase-3, cleaved caspase-9 and p53 levels. The columns show the mean for 3 separate experiments; bars, standard deviation. * P<0.05, ** P<0.01

