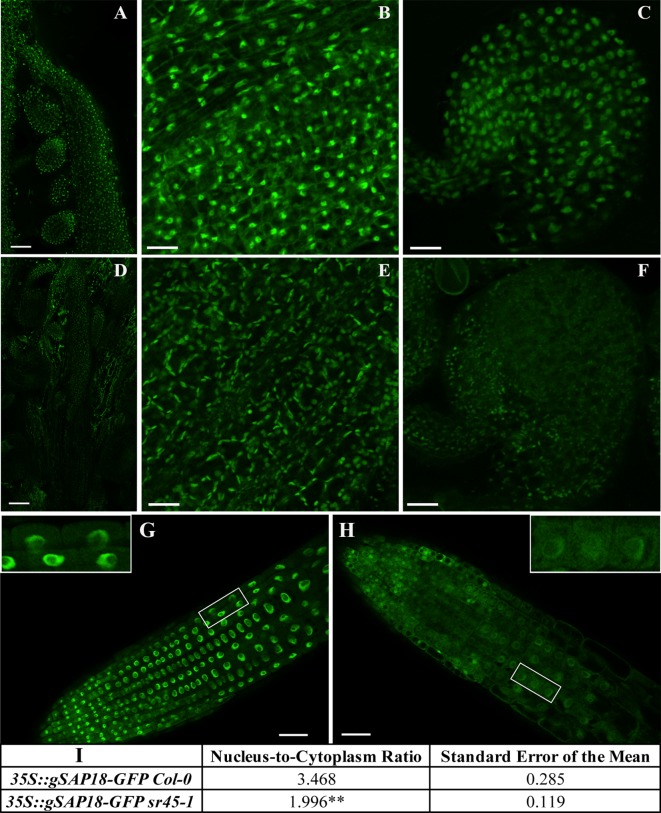
Figure 3.
A comparison of SAP18-GFP expression between Col-0 and sr45-1. A-C and G represent Col-0 transgenic; D-F and H represent sr45-1 transgenic. (A) and (D): carpel containing ovule inside with scale bars = 50 µm. (B) and (E): a close-up view of carpel cells with scale bars = 25 µm. (C) and (F): a close-up view of ovules with scale bars = 25 µm. (G) and (H): root tip with scale bars = 50 µm. The inserts showed a close-up view of root cells in the boxed area. (I): qualifications of root GFP signal intensity in nucleus vs. cytoplasm. A total of 15 cells were measured per seedling. Three seedling were used for student t-test **: p < 0.01.

