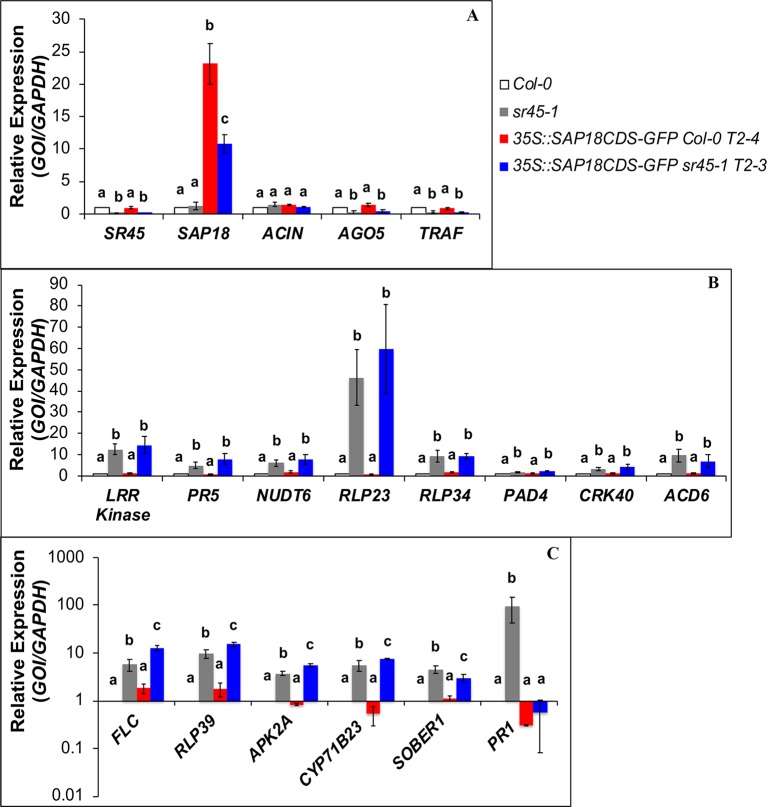
Figure 4.
RT-qPCR on SDR genes in Col-0, sr45-1, 35S::SAP18CDS-GFP Col-0 and 35S::SAP18CDS-GFP sr45-1. (A) SR45-upregulated genes; (B) SR45-downregulated genes that are not affected by SAP18-GFP overexpression; (C) SR45-downregulated genes that are affected by SAP18-GFP overexpression. One-way ANOVA followed by Tukey HSD was used for statistical analysis. Letters a–c represent different levels of statistical significance with p < 0.05. n = 3. Error bars represent standard deviation.

