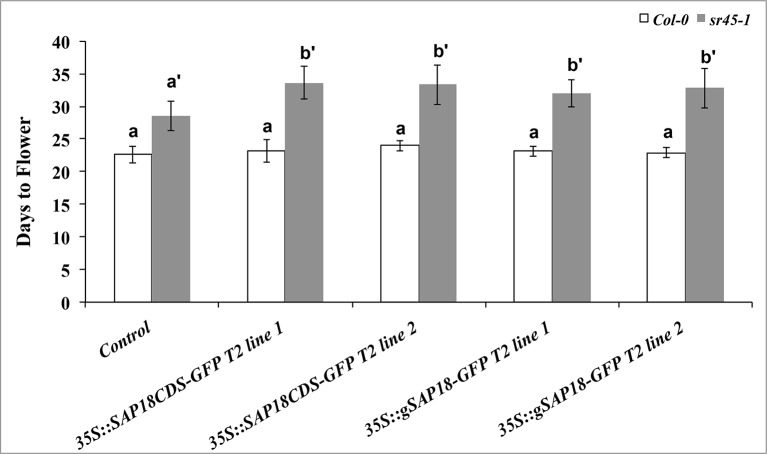
Figure 5.
A comparison of flowering time among different genotypes grown under long-day condition (L:D = 16:8). The number of days before bolting is used to indicate days to flower. Transgenic lines were compared with their corresponding controls (Col-0 or sr45-1), respectively. Kruskal-Wallis test followed by post-hoc Dunn test was used for statistical analysis. Benjamini-Hochberg FDR method was used to calculate adjusted p-values. Letter a represents statistical level of Col-0 and its transgenic lines; letters a’ and b’ represent different levels of statistical significance for sr45-1 and its transgenic lines. n = 10. FDR < 0.05. Error bars represent standard deviation.

