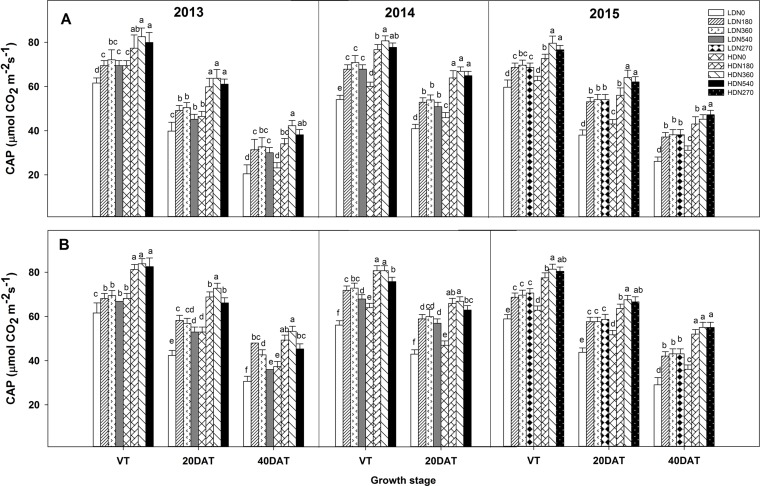
Figure 4.
Effects of density and nitrogen application rate on the canopy apparent photosynthesis (CAP) of DH618 (A) and DH605 (B) during the 2013–2015 growing seasons. LD and HD refer to low density and high density; N0, N180, N270, N360, and N540 represent nitrogen rates of 0, 180, 270, 360, and 540 kg ha−1, respectively. VT, 20DAT, and 40DAT represent the tasseling stage and 20 and 40 days after tasseling, respectively. Different lowercase letters at the same growth stage indicate significant differences (p < 0.05) among the treatments.

