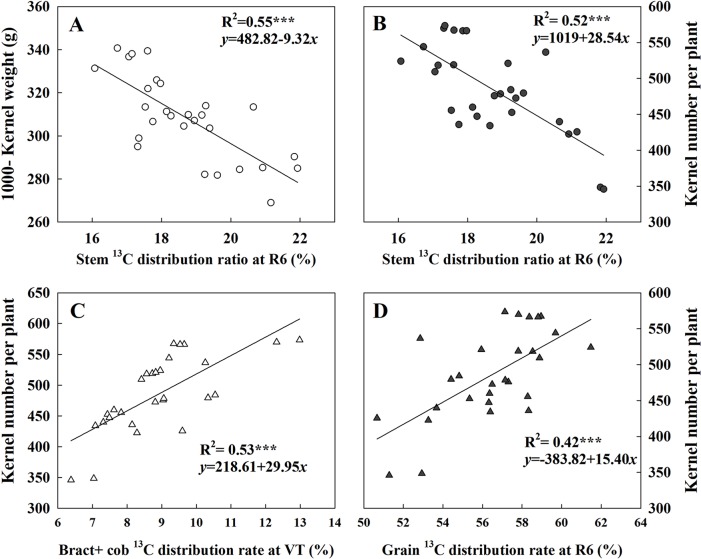
Figure 8.
Relationships between 13C-photosynthate allocation ratio (%) in different organs and 1,000-kernel weight and kernel number. Data correspond to plants grown at low and high densities with different levels of nitrogen. The correlation coefficients (R2) were calculated. ***Significance at the 0.001 probability level (n = 28).

