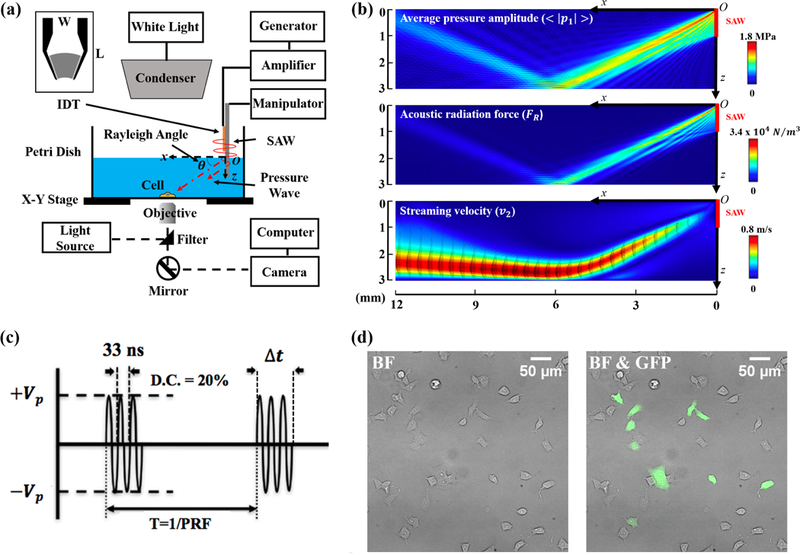
Figure 1: VD-SAW experimental system used for cell study.

(a) Schematic illustration of the VD-SAW experimental platform. A modulated sinusoidal signal is generated by a function generator, amplified by a 55-dB power amplifier to drive the IDT (L × W = 12 × 8 mm), mounted on a holder. The position of the IDT is manipulated by a three-axis micromanipulator. (b) Calculation results of the average pressure amplitude , acoustic radiation force density (FR) and streaming velocity (v2) with black arrow representing velocity vector obtained by numerical simulation in COMSOL. (c) Modulated input signals at 30 MHz center frequency (33 ns period) with different parameters used in the experiments (Vp: peak voltage, T: pulse repetition period, PRF: pulse repetition frequency, D.C.: duty cycle, At: burst duration). (d) Bright field (BF) image of a typical group of HEK-P1KO cells (left) with overlaid fluorescent image of HEK-P1TF cells expressing Piezol-IRES-GFP in green (right).
