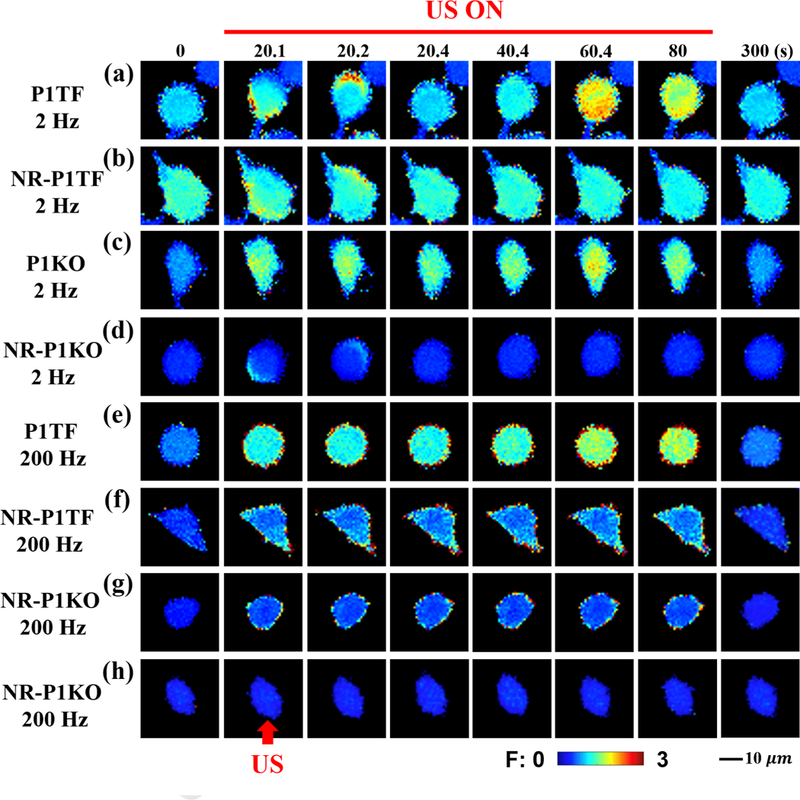
Figure 3: Representative time-elapsed images of intracellular calcium response elicited in different cell types and under various treatment conditions.

(a) responsive P1TF cell treated at 2 Hz PRF, (b) non-responsive P1TF (NR-P1TF) cell treated at 2 Hz PRF, (c) responsive P1KO cell treated at 2 Hz PRF, (d) non-responsive P1KO (NR-P1KO) cell treated at 2 Hz PRF, (e) responsive P1TF cell treated at 200 Hz PRF, (f) non-responsive P1TF (NR-P1TF) cell treated at 200 Hz PRF, (g) and (h) non-responsive P1KO (NR-P1KO) cell treated at 200 Hz PRF. The red arrow indicates the direction of the incident pulsed US. All images share the same length and ratio change scale bars.
