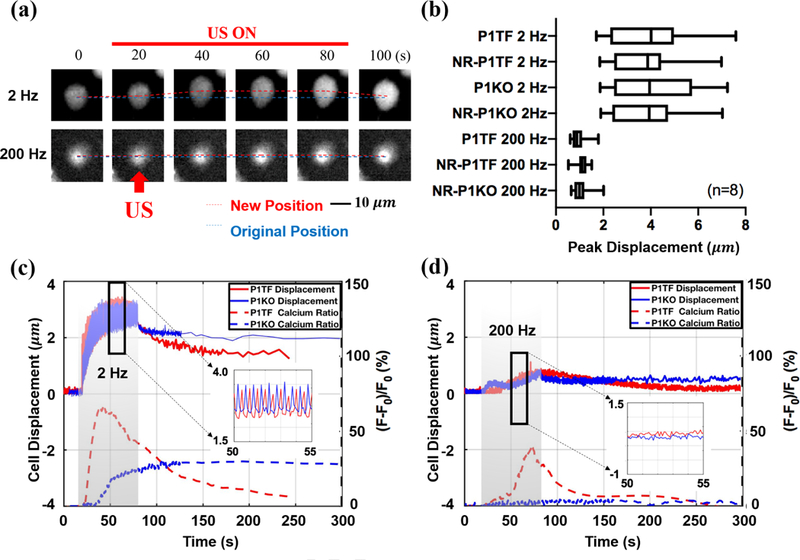
Figure 4: Cell displacement produced by pulsed US of different PRF.

(a) Illustration of the cell displacement in response to pulsed US of 2 Hz and 200 Hz PRF. The red dashed line indicates the time varying positions of the brightest spots (380 nm intensity) on the cell surface tracked by TrackMate, and the blue dashed line indicates its original position. The red arrow indicates the direction of the incident pulsed US. (b) Peak cell displacement in different cell groups treated by the pulsed US at 2 Hz and 200 Hz PRF. (c) and (d) Typical curves of cell displacement over time and the associated normalized 340 nm/380 nm ratio change [(F–F0)/F0] induced by pulsed US at 2 Hz and 200 Hz PRF in different cell groups.
