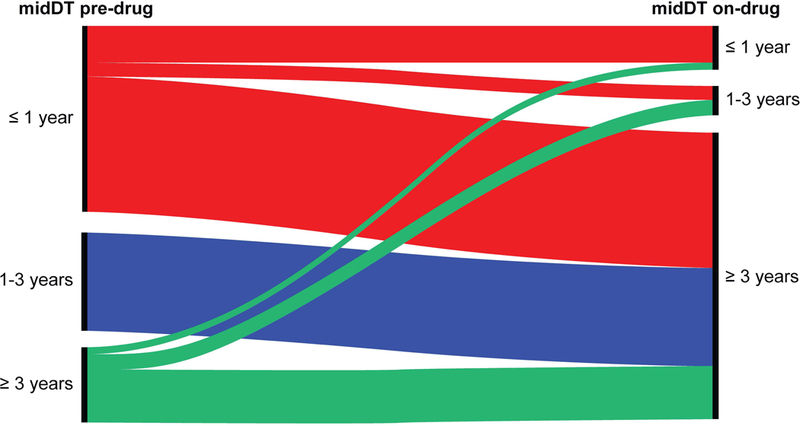
Figure 2: Alluvial graph depicting MTT- induced change in lung midDT.

The figure depicts the change in midDT from baseline pre-drug midDT (on left hand side) to achieved on-drug midDT (right hand side). In the left side of the graph, the midDT groups (midDT≤ 1 year, midDT 1−3 years and midDT ≥ 3 years) are divided into 3 cluster nodes (vertical bolded lines). Similarly, the achieved on-drug midDT groups (midDT ≤ 1 year, midDT 1−3 years, midDT ≥ 3 years) are divided in 3 clustered nodes (vertical bolded lines) . The height of nodes represents the proportion of patients in each midDT group. The color stream fields represent the change in midDT from before the drug was started to after drug is instituted
