Fig. 2.

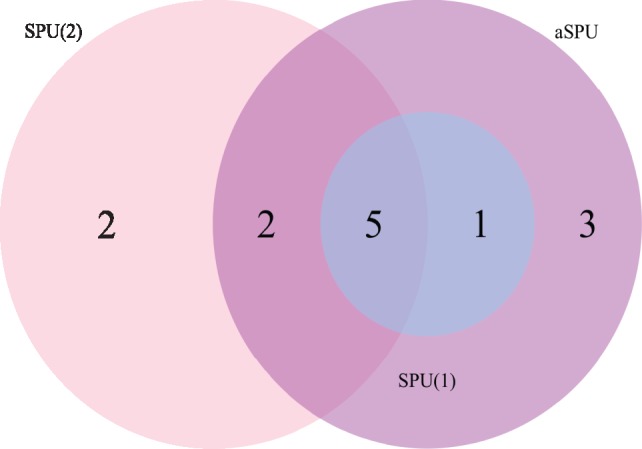
Venn diagrams of the significant and novel genes identified by the ‘E + G+Methyl’ with different methods applied to the SCZ1 data. We combined the results of using MCF7 and Hippo data, and used the same significance cutoff (P ≤ 5 × 10⁻⁶)

Venn diagrams of the significant and novel genes identified by the ‘E + G+Methyl’ with different methods applied to the SCZ1 data. We combined the results of using MCF7 and Hippo data, and used the same significance cutoff (P ≤ 5 × 10⁻⁶)