
Fig. 3.
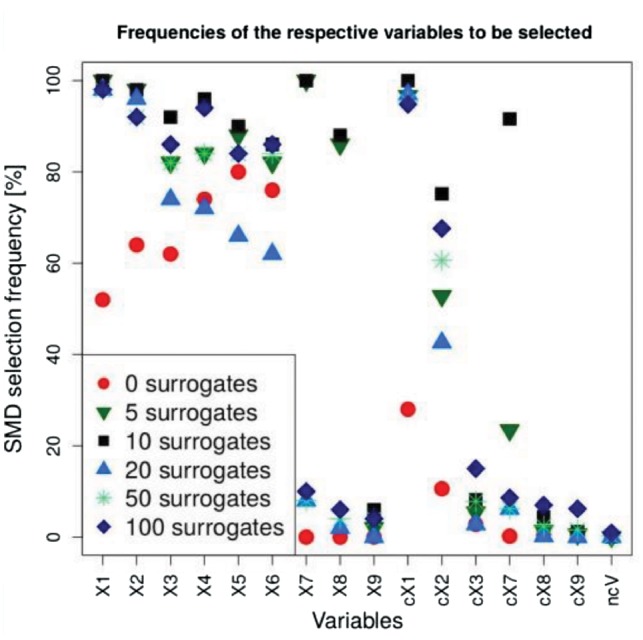
SMD selection frequencies using different numbers of surrogates. For the basic variables each symbol denotes the frequency across all 50 replicates whereas for the six groups of correlated variables (cX1–cX3 and cX7–cX9) as well as the ncVs the average frequency across all variables in the group is shown