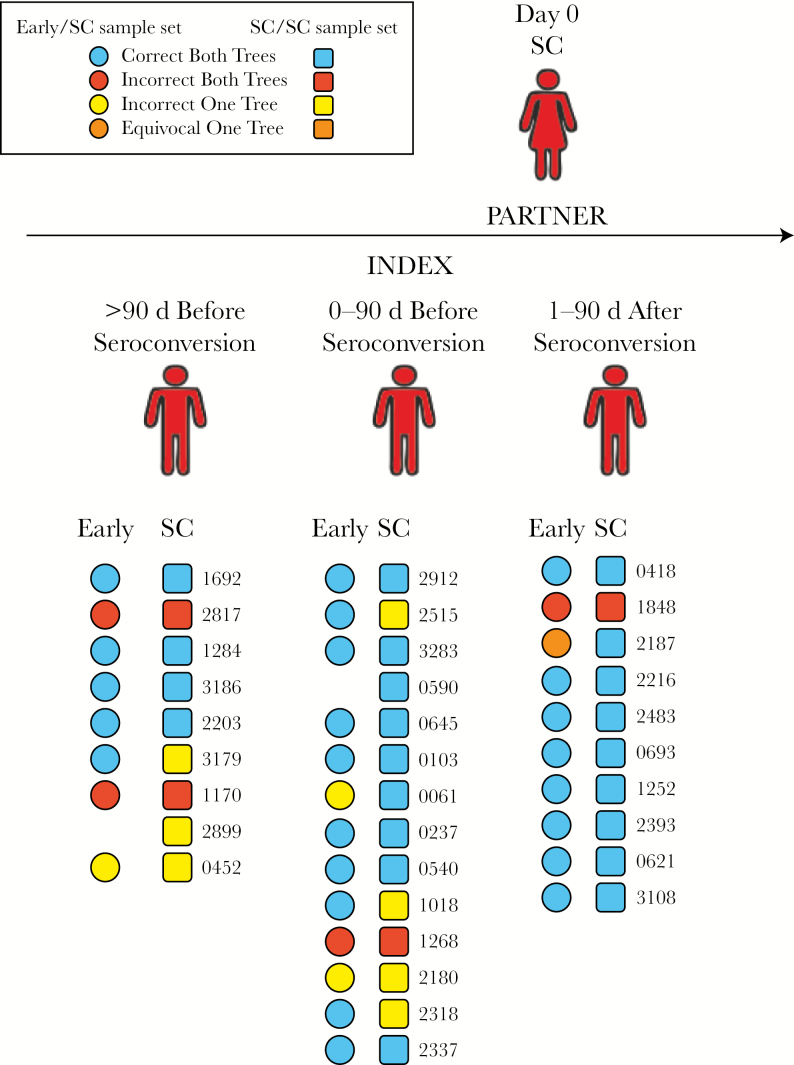
Figure 2.
Predicted direction of human immunodeficiency virus (HIV) transmission, using the single-tree method. Samples were collected from HIV-infected index patients and their partners close to the time when the partner seroconverted (hereafter, “SC samples”); for 31 pairs, samples collected from the index patient at an earlier time point (hereafter, “early index samples”) were also available. Each square or circle represents 1 index patient and partner pair; pairs were created on the basis of the timing of collection of SC samples from partners and index patients. Squares show data obtained for the SC/SC sample set, comprising index patient and partner SC samples; circles show data obtained for the early/SC sample set, comprising early index samples and partner SC samples. The identifier for each index patient and partner pair is shown to the right of the corresponding square. Colors of the squares and circles correspond to the direction of transmission predicted from individual pair trees and subtype-specific trees.

