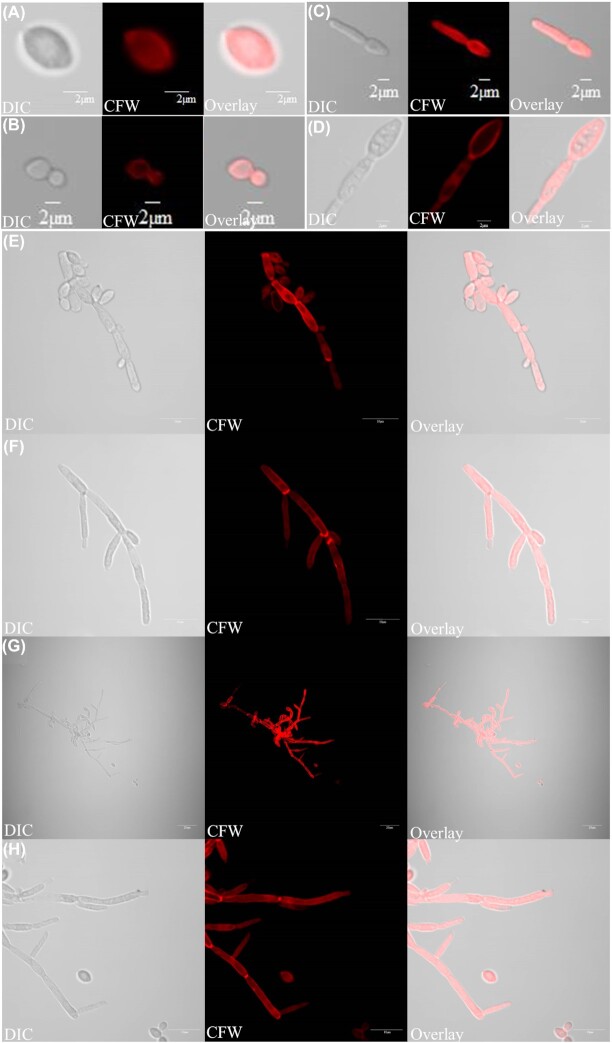
Figure 7.
Different cell morphologies observed in this study: (A) blastospore, (B) budding yeast, (C, D) germ tube, (E) pseudohyphae and (F–H) hyphae. Light (left) and fluorescent (Calcofluor staining; middle) microscopy images of different cell types were overlaid (right). Scale bars: (A–D) 2 μm, (E, F, H) 10 μm and (G) 20 μm.

