FIGURE 3.
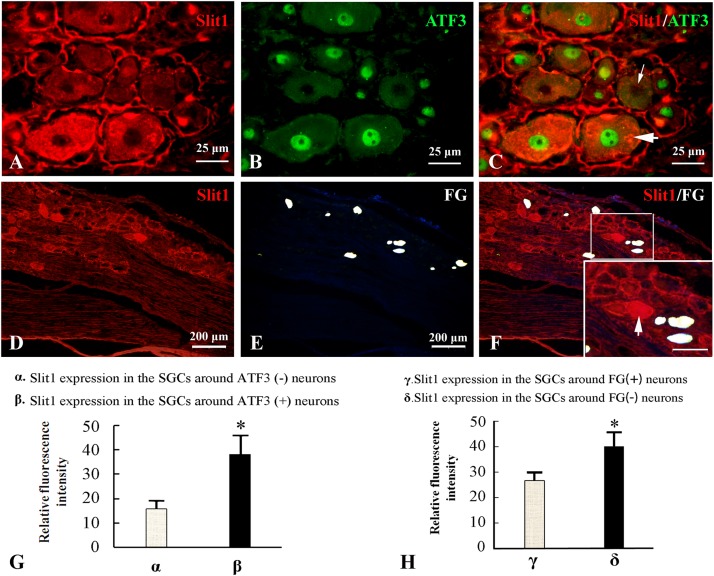
Effects of DRG-injured neuronal soma on Slit1 expression in SGCs. The Slit1 and ATF3 double immunofluorescence labeling method and the Slit1 and FG retrograde labeling method were used to show the expression of Slit1 in SGCs around normal and injured neurons. (A–C) Double immunofluorescence labeling of Slit1 and ATF3 was carried out on DRG sections from 7 days after sciatic nerve crush. (A) Slit1 (red) immunofluorescence staining. (B) ATF3 (green) immunofluorescence staining. (C) Merged images of panels (A,B). The thick arrow indicates ATF3-positive neurons, and the thin arrow indicates ATF3-negative neurons, scale bar = 25 μm. (D–F) Slit1 immunofluorescence staining and FG retrograde labeling. (D) DRG Slit1 immunofluorescence on the 7th day after the operation. (E) FG (white)-traced positive neurons. (F) Merged images of panels (D,E). Scale bar = 200 μm. The large framed image is an enlargement of the small frame, and thin arrows indicate FG-negative neurons in panels (F). (G) Summary histograms depict the changes in the RFI of Slit1 in SGCs surrounding ATF3-positive and negative neurons determined with paired t-tests, ∗ P < 0.001; bars represent the standard error of the mean; RFI, relative fluorescence intensity. (H) Summary histograms depict the changes in the RFI of Slit1 expression in SGCs surrounding FG-negative and FG-positive neurons determined with paired t-tests, ∗P < 0.001; bars represent the standard error of the mean; RFI, relative fluorescence intensity.

