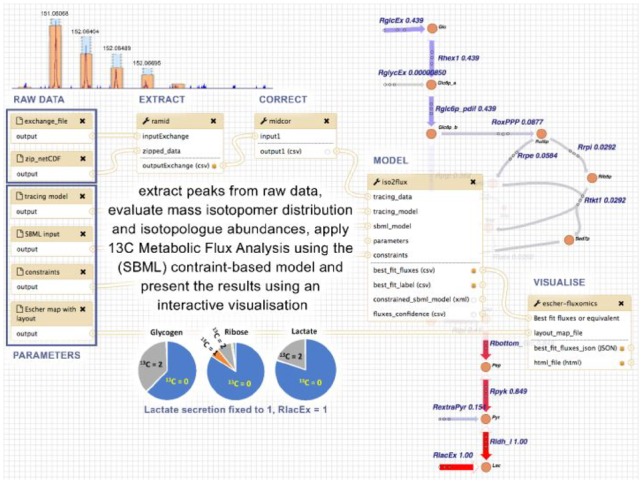
Fig. 6.

Overview of the workflow for fluxomics, with Ramid, Midcor, Iso2Flux and Escher-fluxomics tools supporting subsequent steps of the analysis. The example refers to HUVEC cells incubated in the presence of [1,2-13C2]glucose and label (13C) propagation to glycogen, RNA ribose and lactate measured by mass spectrometry. Ramid reads the raw netCDF files, corrects baseline and extracts the peak intensities. The resulting peak intensities are corrected (natural abundance, overlapping peaks) by Midcor, which provides isotopologue abundances. Isotopologue abundances, together with a model description (SBML model, tracing data, constraints), are used by Iso2Flux to provide flux distributions through glycolysis and pentose-phosphate pathways, which are shown as numerical values associated to a metabolic scheme of the model by the Escher-fluxomics tool
