
Fig. 3.
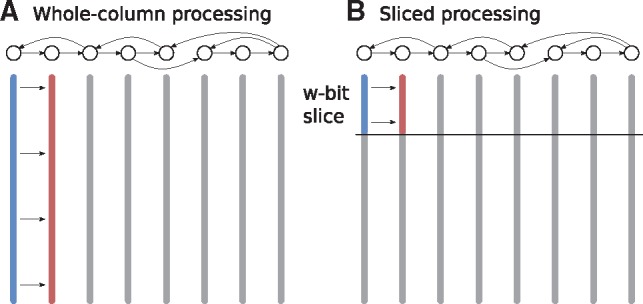
The DP table for aligning a sequence to a graph (shown on top) is represented by a set of columns (vertical bars), each corresponding to one graph node. The table can be filled in different orders: (A) each update operation (from blue to red) proceeds on a complete column. (B) Update operations commence on ‘slices’ of w bits; only after the final values in a slice (i.e. for all columns) have been computed, we proceed to the next slice