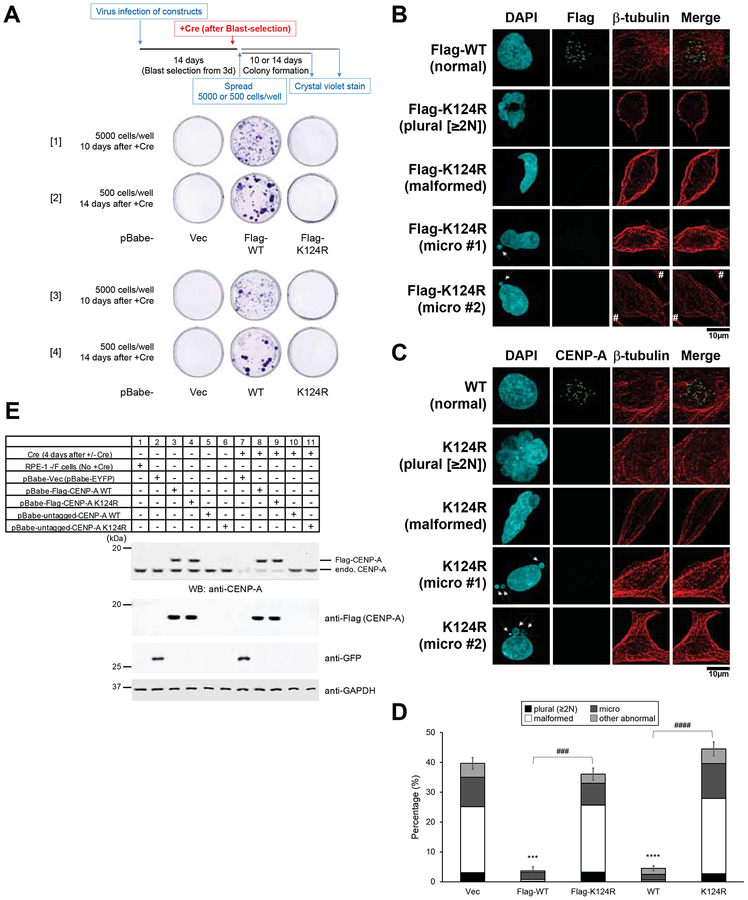
Figure 3. Flag-tagged and untagged CENP-A-K124R mutants are lethal.
(A) Representative images from the colony outgrowth assay as shown in schematic (top) of different conditions ([1] and [2] of Flag-CENP-A; [3] and [4] of untagged CENP-A). Experiments conducted under other conditions yielded similar results (data not shown). pBabe-Vec: pBabe-EYFP.
(B) Abnormal nuclei were revealed by DAPI staining in the Flag-CENP-A K124R transfectants at a higher frequency than in WT. CENP-A−/F RPE-1 cells were cotransfected with indicated constructs, cultured 14 days under blasticidin S selection, and infected with retro-Cre virus infection (which mimics the culture conditions shown in Figure 3A, [1] and [2]). Cells were collected and immunostained (see Immunofluorescence in STAR METHODS) at 4 days after Cre infection. DAPI (blue), Flag (green), and endogenous -tubulin (red) were used to show the cytoskeletal structure. Hash (#) indicates signals from other interphase cells just outside the inset. Arrows indicate micronuclei. Plural, fragmented, and aggregated nuclei consisting of 2 or more nuclei-like fragments including binuclei; malformed, malformed nuclei; micronuclei (arrow); normal, normally shaped nuclei. Scale bar, 10 μm.
(C) Abnormal nuclei were observed by DAPI stain in the untagged-CENP-A K124R transfectants more frequently than in WT. CENP-A−/F RPE-1 cells were cotransfected with the indicated constructs, cultured 14 days under blasticidin S selection, and infected with retro-Cre virus infection (which mimics culture conditions shown in Figure 3A, [3] and [4]). Cells were collected and immunostained (see Immunofluorescence in STAR METHODS) 4 days after Cre infection. DAPI (blue), CENP-A (green), and endogenous -tubulin (red) were used to show the cytoskeletal structure. Arrows indicate micronuclei. Plural, fragmented and aggregated nuclei consisting of 2 or more nuclei-like fragments including binuclei; malformed, malformed nuclei; micronuclei (arrow); normal or normaly shaped nuclei. Scale bar, 10 μm.
(D) Histogram summarizing the abnormal nuclei shown in panels (B) and (C). More than 200 interphase cells were counted per experiment (n ≥ 3 experiments), and the mean percentages (±SEM) are shown based on the summed population: plural + malformed + micro + other abnormal. Other types of abnormal nuclei previously reported (Niikura et al., 2015) (e.g., chromosome bridges), or nuclei of damaged cells or dead cells are presumably due to transfection or other treatments (images not shown). ****p < 0.0001 and ***p < 0.001 when compared with the vector control (Vec: pBabe-EYFP) (Student’s t test). ####p < 0.0001 and ###p < 0.001 when WT and K124R were compared (Student’s t test).
(E) Confirmation of CENP-A KO by Western blot analysis. Immunoblots were performed to determine the level of expression of the indicated rescue constructs (ca. 15–20 kDa), and the loss of endogenous CENP-A protein (ca. 16 kDa) was confirmed in the CENP-A−/− cell lines collected 4 days after Cre infection. GAPDH protein was used as a loading control.

