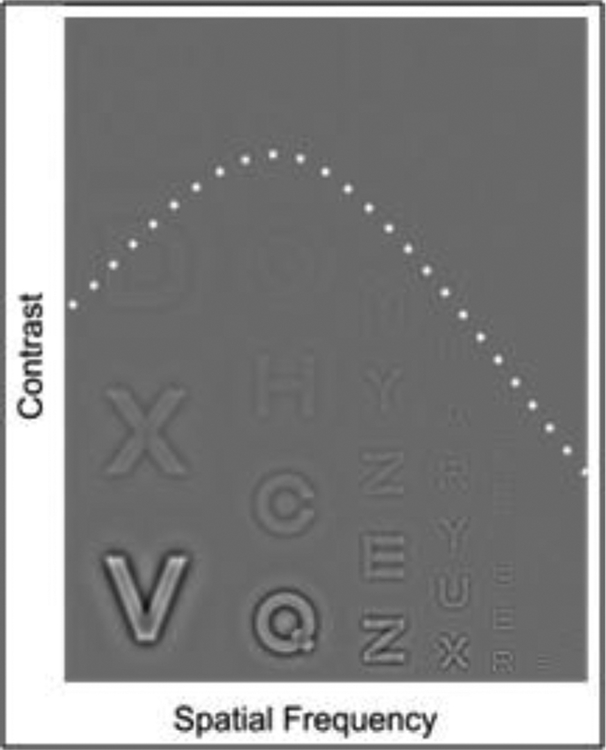
Figure 2:
Example Contrast Sensitivity Function. Contrast increases from top to bottom and spatial frequency increases from left to right most observers perceive an inverted U shape that separates visible from non-visible letters, illustrated by the dashed line. Adapted from24).

