FIGURE 2.
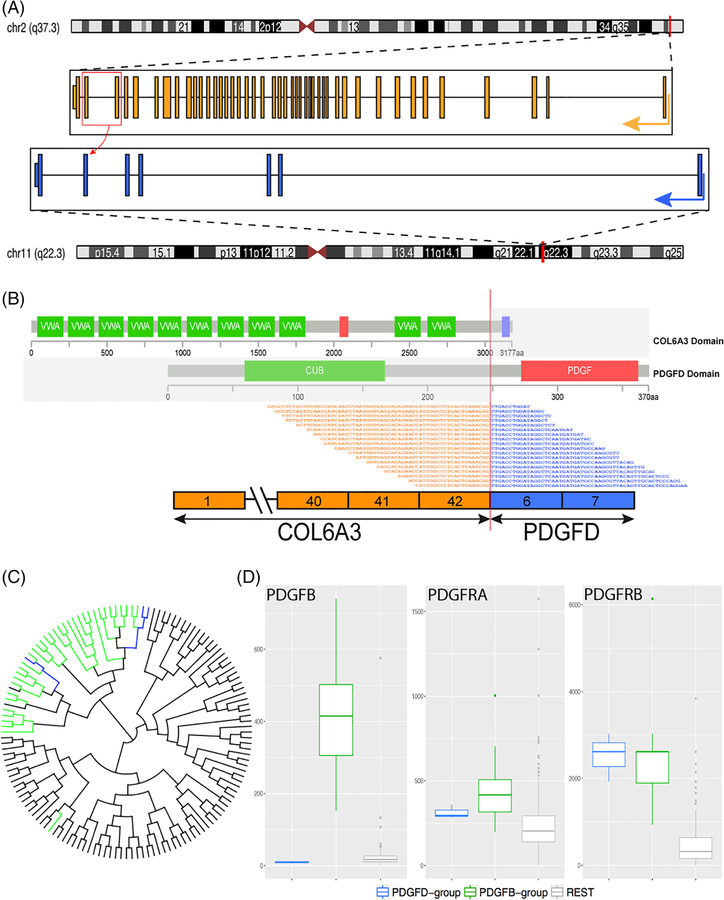
COL6A3-PDGFD fusion structure and molecular correlates. (A) Diagrammatic representation of COL6A3 gene on 2q37.3 fused to PDGFD gene on 11q22.3. Red box and curved arrow depict 2 fusion transcript variants in which COL6A3 exons 42 and 43, respectively, are fused with exon 6 of PDGFD. (B) Representative sequences from RNAseq data demonstrating the fusion of COL6A3 exon 42 was fused to exon 6 of PDGFD, with emphasis on the protein domains projected to be retained in the fusion oncoprotein. (C) Unsupervised hierarchical clustering of RNAseq data showing that the 3 COL6A3-PDGFD fusion positive tumors (blue) cluster together with the 34 cases of dermatofibrosarcoma protuberans (green) with the classic COL1A1-PDGFB fusion, and away from other sarcoma types (gray) studied on the same targeted RNAseq platform. (D, left) box plot showing high levels of expression of PDGFB mRNA in the control group (green) compared with the study group (blue) and other sarcomas (gray); (D, center) PDGFRA levels are not increased in any tumor category, while (D, right) PDGFRB mRNA is upregulated in both PDGFD (blue) and PDGFB (green) fusion positive DFSP compared with other sarcoma types (gray) [Color figure can be viewed at wileyonlinelibrary.com]

