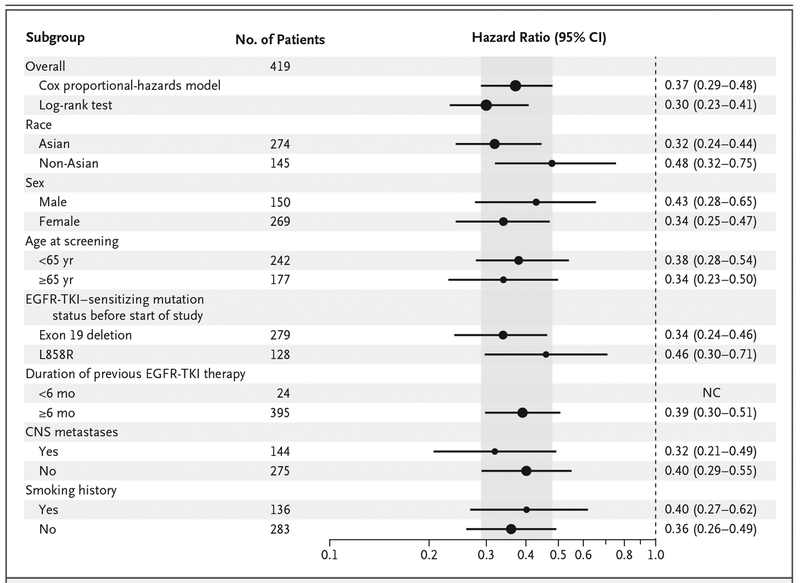
Figure 2. Subgroup Analyses of Progression-free Survival.
A hazard ratio of less than 1 indicates a lower risk of progression in the osimertinib group. The Cox proportional-hazards model includes randomized treatment, the subgroup covariate of interest, and the treatment according to subgroup interaction. The size of the circles is proportional to the number of events. Overall population analyses are presented from both a Cox proportional-hazards model and the primary analysis (U and V statistics from a log-rank test stratified according to race). If there were fewer than 20 events in any subgroup, then the analysis was not performed. The shaded area indicates the 95% CI for the overall hazard ratio (all patients). NC denotes could not be calculated.

