Figure 1.

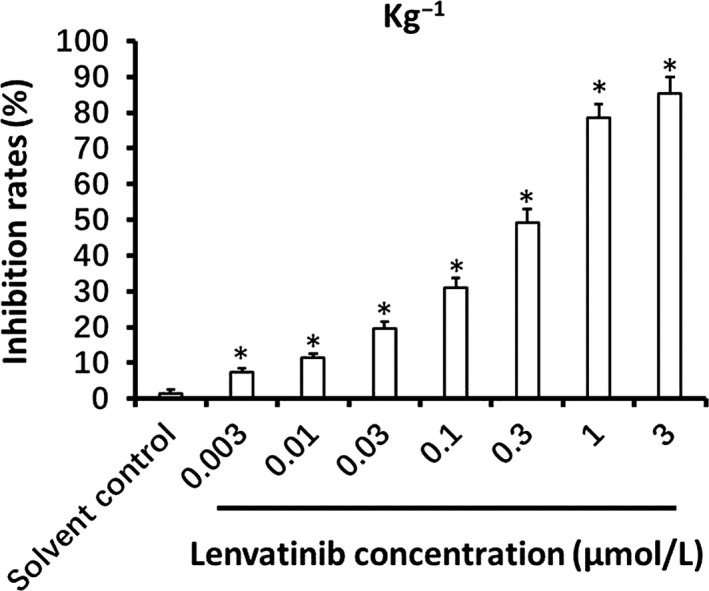
The anti‐tumor effect of lenvatinib on Kg‐1 cells. Kg‐1 cells treated with the indicated concentrations of lenvatinib were analyzed by MTT assay. Inhibition rates of lenvatinib on Kg‐1 cells are shown as means ± SD. *P < .05, lenvatinib treatment group versus solvent control group
