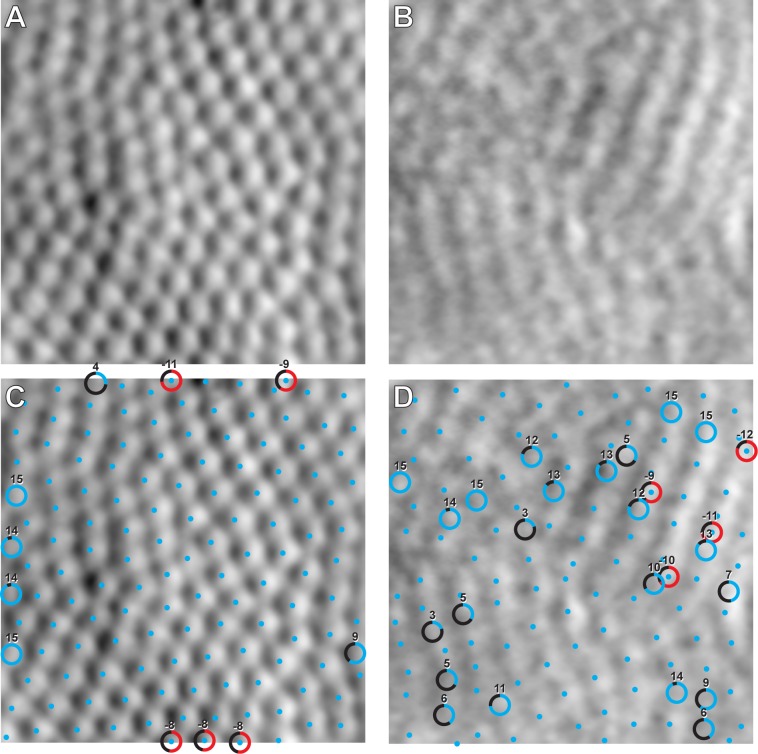
Fig 2. Extremes of interobserver agreement.
(A) The image with the highest agreement (lowest variance) in photoreceptor identification. (B) The image with the lowest agreement (highest variance) in photoreceptor identification from the euthermic image set. (C) and (D) show the results of the cone segmentation algorithm (blue dots) with observer corrections. Circles indicate photoreceptors that were added (blue gradient) or removed (red gradient) by more than one observer, and the number outside the circle denotes how many times the photoreceptor was added or removed (15 being the maximum). In panel (D), three out of four commonly removed cells overlapped with added cells, suggesting that these were cells simply shifted to a new location rather than truly being added or removed.

