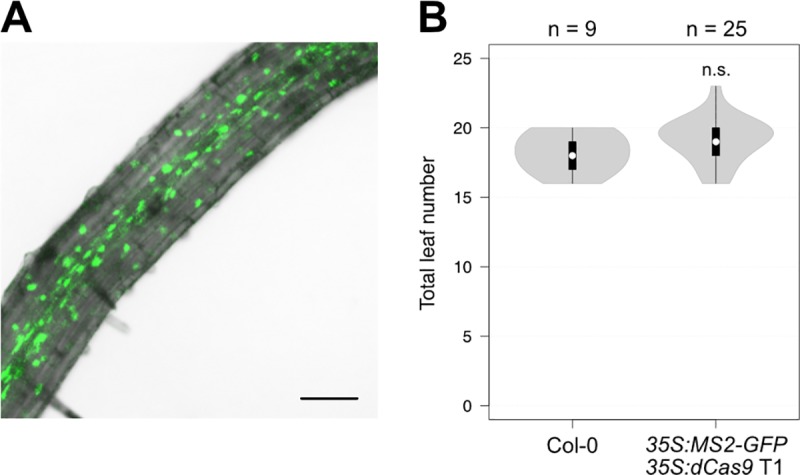
Fig 3. The dCas9 complex does not affect flowering time when associated with MS2-GFP.

(A) MS2-GFP fluorescence was detected in the nuclei of root cells in homozygous 35S:MS2-GFP T3 plants. Image shows overlay of GFP fluorescence on bright field. Bar = 100 μm. (B) Flowering time of wild type Col-0 and 35S:MS2-GFP T1 plants grown in LDs. Violin plots represent density estimates of data, with white circles showing the median, black bars showing the interquartile range, and whiskers extending to data points up to 1.5 times the interquartile range from the first and third quartiles. Numbers of plants are shown above the chart, and significant difference from Col-0, calculated using Student’s t-test, is indicated above the violin plot. n.s. = not significant.
