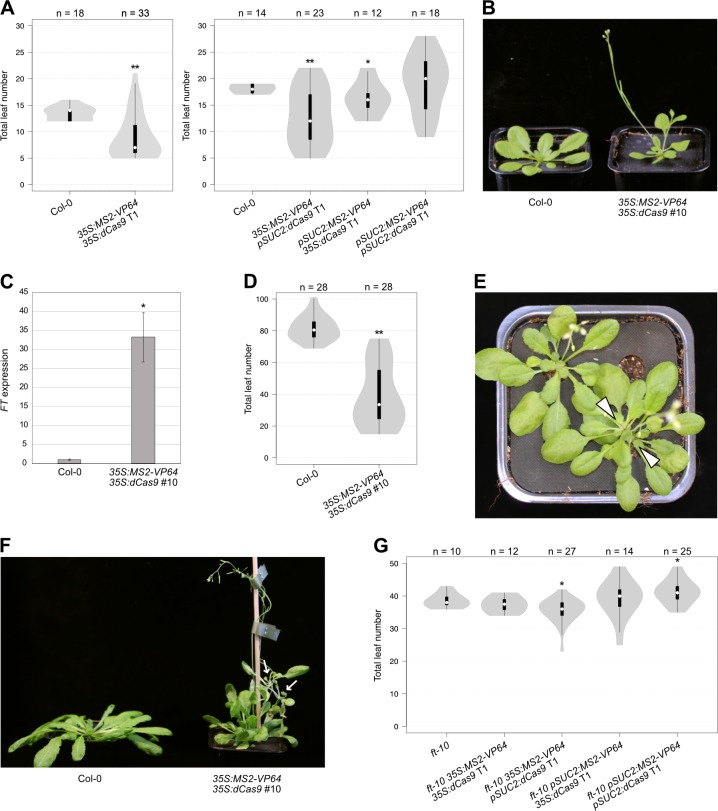
Fig 4. Targeted regulation of FT by MS2-VP64/dCas9 leads to increased FT expression and early flowering.
(A) Flowering time of wild type Col-0 and MS2-VP64/dCas9 T1 plants grown in LDs. (B) Phenotypes of 4-week-old Col-0 and homozygous 35S:MS2-VP64/35S:dCas9 T3 plants grown in LDs. (C) Expression of FT in 6-day-old Col-0 and homozygous 35S:MS2-VP64/35S:dCas9 T3 plants grown in LDs. Whole seedlings were harvested at Zeitgeber time (ZT) 15, and transcript levels were measured by qPCR, normalised against TUBULIN2 (TUB2) and shown relative to Col-0. Values are the mean of three biological replicates ± standard error. Significant difference from Col-0 was calculated using Student’s t-test. * = P < 0.05. (D) Flowering time of Col-0 and homozygous 35S:MS2-VP64/35S:dCas9 T3 plants grown in SDs. (E, F) Phenotypes of (E) 7- and (F) 8-week-old homozygous 35S:MS2-VP64/35S:dCas9 T3 plants grown in SDs. Many of the SD-grown transgenic plants developed two rosette-producing meristems at ground level, (white arrowheads in E), while some individuals formed aerial rosettes on the bolting inflorescence stem (white arrows in F). Single cauline leaves were never observed on plants of either phenotype. (G) Flowering time of untransformed ft-10 mutants and ft-10 MS2-VP64/dCas9 T1 plants grown in LDs. Violin plots in (A), (D) and (G) represent density estimates of data, with white circles showing the median, black bars showing the interquartile range, and whiskers extending to data points up to 1.5 times the interquartile range from the first and third quartiles. Numbers of plants are shown above the charts, and significant differences from controls, calculated using Student’s t-test, are indicated above the violin plots. ** = P < 0.001, * = P < 0.05.

