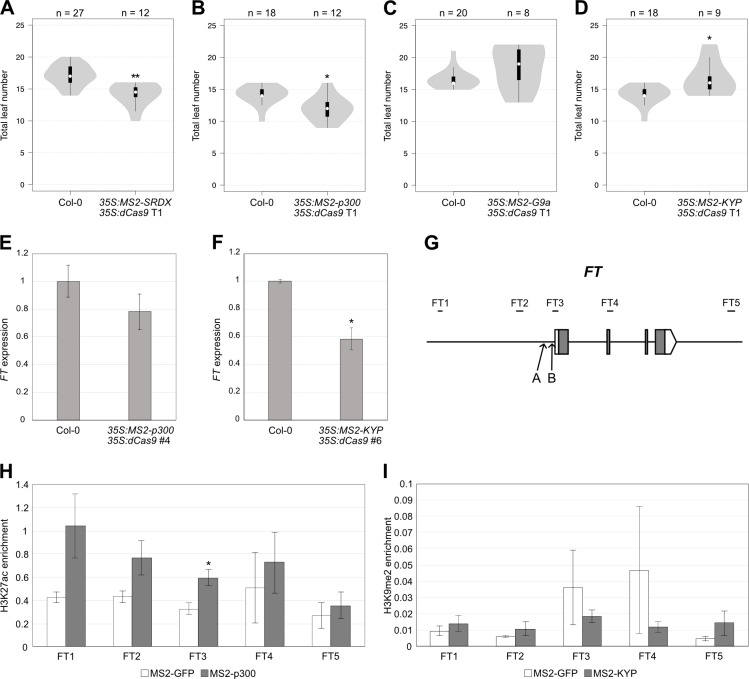
Fig 5. Different MS2-effector fusions regulate FT with varying levels of effectiveness.
(A-D) Flowering time of wild type Col-0 and (A) MS2-SRDX, (B) MS2-p300, (C) MS2-G9a and (D) MS2-KYP T1 plants grown in LDs. Violin plots represent density estimates of data, with white circles showing the median, black bars showing the interquartile range, and whiskers extending to data points up to 1.5 times the interquartile range from the first and third quartiles. Numbers of plants are shown above the charts, and significant differences from Col-0, calculated using Student’s t-test, are indicated above the violin plots. ** = P < 0.001, * = P < 0.05. (E, F) Expression of FT in (E) 8-day-old Col-0 and homozygous MS2-p300 T3 plants, and (F) 12-day-old Col-0 and homozygous MS2-KYP T3 plants grown in LDs. Whole seedlings were harvested at ZT 15, and transcript levels were measured by qPCR, normalised against TUB2 and shown relative to Col-0. Values are the mean of three biological replicates ± standard error. Significant differences from Col-0 were calculated using Student’s t-test. * = P < 0.05. (G) Schematic of the FT locus, showing the positions of the sgRNA target sites, A and B, and the regions that were amplified to measure histone mark enrichment. Grey boxes represent the FT coding sequence and white boxes represent untranslated regions. (H, I) Enrichment of (H) H3K27ac and (I) H3K9me2 in homozygous MS2-p300 and MS2-KYP T3 plants, respectively. ChIP experiments were carried out using chromatin from homozygous 15-day-old seedlings grown in LDs. Enrichment of histone marks was measured by qPCR, and data were normalised against either the highly transcribed RBCS1A gene (H) or the Cinful-like retrotransposon T5L23.29 (I). Values are the mean of three biological replicates ± standard error. Significant differences from MS2-GFP were calculated using Student’s t-test. * = P < 0.05.

