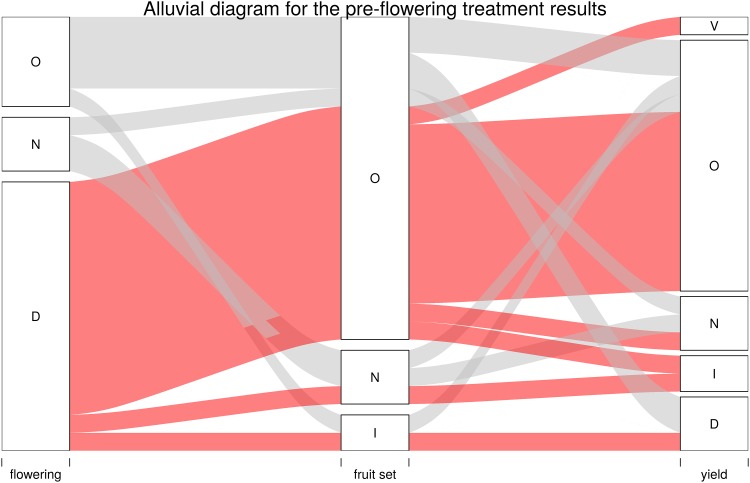
Fig 8. Alluvial diagram for the pre-flowering treatment results.
Only the pre-flowering treatment studies were considered. The effect of GA pre-flowering treatments on flowering, fruit set and yield for each reviewed publication was noted as follows: N, no effect; I, increase; D, decrease; O, not studied and V, variable result. Bandwidth reflects the number of publications. The narrowest bandwidth represents a single publication. Red denotes the articles in which GA decreased flowering, while gray denotes the articles in which GA had a different effect.

