
Fig 1.
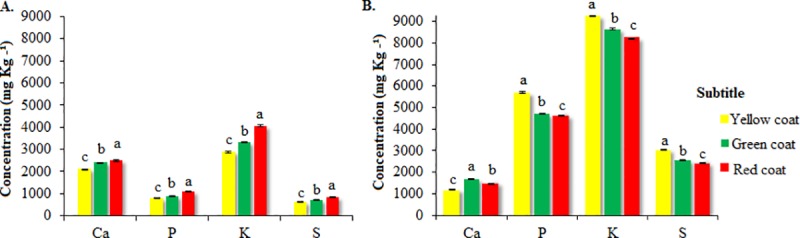
Ca, P, K, and S concentration in the seed coat (A) and whole seed (B) in function of the coat colour of C. ochroleuca seeds. Bars indicate the standard deviation of the mean (n = 3). Different letters indicate a difference between the means (Tukey, p ≤ 0.05). CVa (%) = 0.79 (Ca), 1.72 (P), 0.96 (K), and 1.39 (S). CVb (%) = 1.25 (Ca), 0.71 (P), 0.22 (K) and 0.61 (S).